Loading...
Options Flow deep dive · 18 min read
How to Read Live Options Flow
A complete walkthrough of Flow Summary, the live $20k+ options tape rolled up per ticker. Every card element, filter, sort, and daily routine explained with real numbers from the October 1, 2026 session.
Open the tool →Hey guys, Art from TraderMatrix here. The page I want to walk you through is Flow Summary, found under Options Flow in the nav. It lives at /live-flow and it's the one I come back to most often during the session. This guide goes through every element on the page, every number on the cards, and how to build a routine around it using real data from October 1, 2026.
The short version:
- Flow Summary rolls up every $20k+ options print per ticker; no score filter, no percentile cutoff.
- The bull/bear bar is dollar-weighted, not a call/put count. Read both the bar and the footer percentage.
- Sort by Most Bullish (not Total Premium) to find names with the cleanest directional lean.
- Hide 0DTE when you want flow reflecting a multi-day thesis, not intraday mechanics.
- A golden sweep inside a net-bearish card does not override the card; context still matters.
What this page is and what it isn't
A lot of people open Flow Summary expecting to see the same feed as the Unusual Activity page. The two are doing different jobs.
Unusual Activity runs every options print through a scoring engine. That engine weighs volume-to-open-interest ratio, premium size, bid-ask spread, and days to expiry, then surfaces only the prints that clear a threshold. You're seeing individual standout trades, ranked by how anomalous they look. It's designed to catch something weird happening on a specific ticker.
Flow Summary is a different lens. It takes every single options trade that clears $20,000 in premium, no score filter, no percentile cutoff, and rolls it up by ticker. One card per symbol. Each card shows you the net directional lean for that name during the session: how much dollar premium went bullish versus bearish, how many individual trades built that reading, and the single biggest print that landed.
The distinction matters: Unusual Activity shows you individual prints that look anomalous. Flow Summary shows you where premium is concentrating across the whole tape, and which direction the money leans, per ticker.
The $20k floor is the only entry requirement. A routine 200-lot call sweep at $25k flows into the card exactly the same as a $3 million golden sweep. That means the card gives you the full picture of where options premium is going, not just the outlier prints.
Key point: Flow Summary is the aggregate picture. Unusual Activity shows individual standout prints. Use both; they answer different questions.
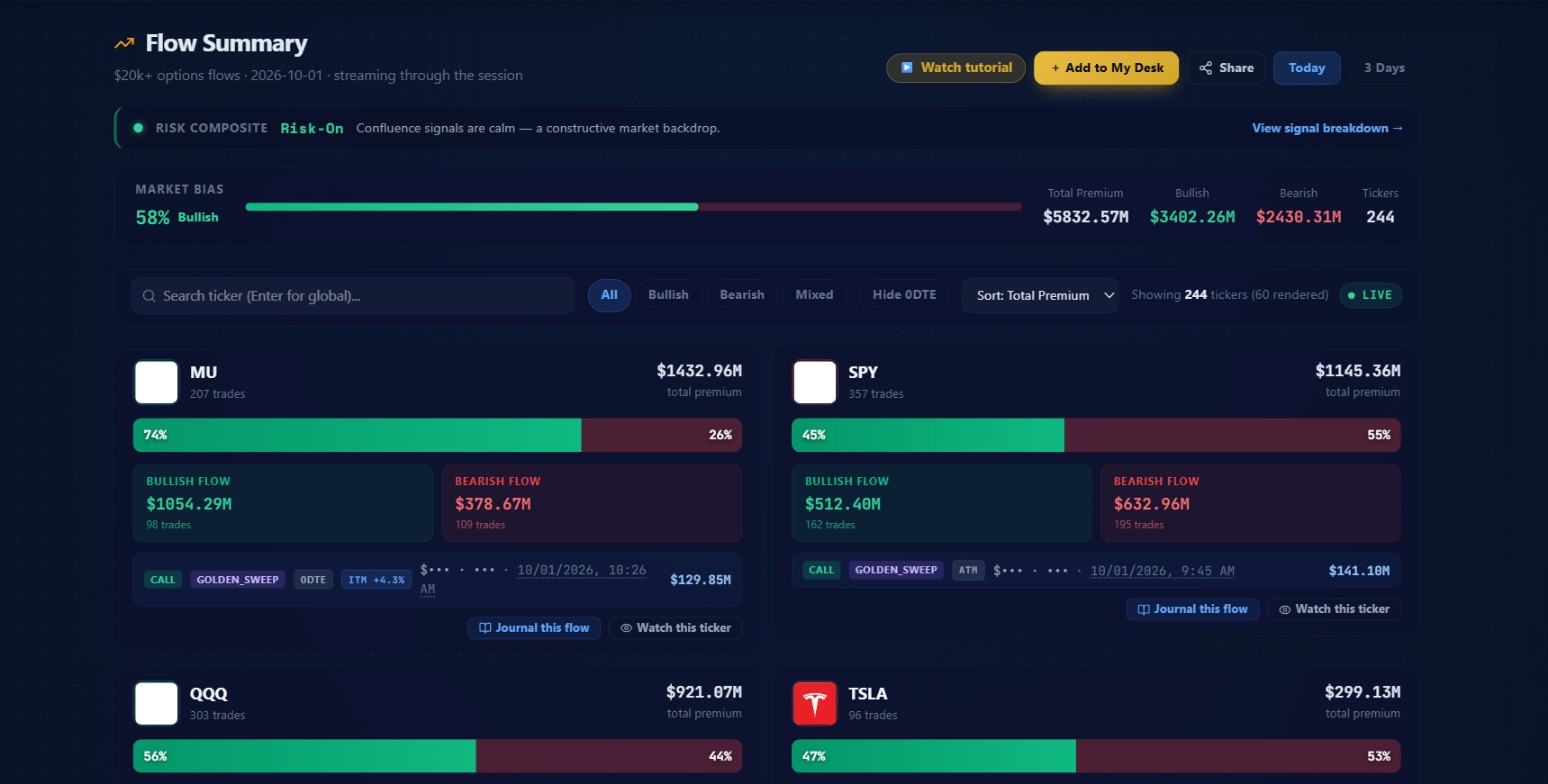 Read the market-level numbers at the top before you look at a single card. The bias bar and total premium figures frame everything below them.
The risk composite strip
Just below the page header is the RISK COMPOSITE strip. On October 1 it read "Risk-On" with the note that confluence signals were calm and the backdrop was constructive. This composite pulls from the same signals that drive the risk readings across other pages on the platform. Seeing it here, before anything else on the page, matters.
A Risk-Off reading while you're looking at a screen full of bullish cards isn't a reason to ignore the flow, but it's a reason to size smaller or wait for confirmation. A Risk-On reading with a 58% bullish bias bar is a different environment to trade into. The "View signal breakdown" link on the right takes you to the full breakdown of what's behind the composite.
The market bias bar
Under the strip is MARKET BIAS. On October 1 it showed 58% Bullish. That number is dollar-weighted, not a count of trades or a count of tickers. It represents what share of all $20k+ premium during the session landed in calls executed at or above the ask (bullish fills) versus puts. Green bar equals bullish premium share. Red bar equals bearish.
The four stats to the right:
Total Premium: the full sum of all qualifying trades that session. October 1 came in at $5,832.57M, roughly $5.8 billion in notional options premium.
Bullish: $3,402.26M of that went into bullish prints.
Bearish: $2,430.31M went bearish.
Tickers: 244 symbols had flow worth showing that particular session.
These numbers are the first thing I check. The market-level bias sets the context. On a day where $5.8 billion is flowing and 58% is bullish, a lopsided bullish card on an individual single-name stock carries a different weight than it would on a day where the bias bar is sitting at 40% bullish with $2 billion less in total premium.
Filters, sorts, and the window
Below the stats is the controls bar. Here is what each piece does.
Sentiment chips: All / Bullish / Bearish / Mixed
All includes every ticker on the tape. Bullish filters to names where the net premium lean is bullish, meaning more than half of the dollar flow went into calls at or above the ask. Bearish is the reverse. Mixed is often underused: these are names where neither side dominated, which can flag two-sided institutional positioning, particularly on high-premium names where both direction and size are telling you something.
Hide 0DTE
This toggle removes tickers whose biggest print of the day was in an option with 0 to 3 days to expiry. The 0DTE cohort is the highest-gamma, highest-noise part of the tape. Same-day expiries show up constantly on SPY, QQQ, and the mega-cap single names. Some of that is genuine directional conviction. A lot of it is market makers delta-hedging, firms closing positions before expiry, and intraday scalpers playing gamma. Same-day and next-day expiries have materially weaker directional follow-through than prints in the 15-30 DTE range. If you are looking for flow that reflects a multi-day thesis rather than an intraday position, flipping Hide 0DTE on cleans up the view considerably.
Watch out: Same-day and next-day expiries have weaker directional follow-through than 15-30 DTE prints. If you are building a thesis from flow, flip Hide 0DTE on first.
Sort options
Six views in the dropdown:
| Sort | What it surfaces |
|---|---|
| Total Premium (default) | Biggest absolute dollar flows |
| Bull Premium | Names where bullish dollars are largest in absolute terms |
| Bear Premium | Names where bearish dollars are largest |
| Most Bullish | Names skewed most heavily bull as a percentage |
| Most Bearish | Names skewed most heavily bear as a percentage |
| Trade Count | Names with the most individual prints, regardless of size |
Total Premium keeps the heaviest-flow names at the top, which are usually SPY and QQQ. Those are useful market-level reads but tend to have inherently mixed flow because hedging traffic runs both directions on index ETFs constantly. When you want conviction rather than volume, switch to Most Bullish or Most Bearish. A name at rank 35 by total premium but sitting at 88% bullish often tells a cleaner story than the index ETFs at the top.
Try this: Switch the sort to Most Bullish after the first check of the day. The default Total Premium view surfaces SPY and QQQ, which have inherently mixed flow. Most Bullish finds names where the lean is cleanest.
The Trade Count sort is worth understanding separately. When a name has 400 trades but only $150 million in premium, the average print is small: $375k per trade. When a name has 40 trades and $300 million, someone is putting up $7.5 million bets repeatedly. Both are meaningful but they suggest different things about who's behind the flow.
Today / 3 Days
Today shows only the current session. Switch to 3 Days to see the accumulated picture from the prior two sessions plus today. A ticker sitting at 70%+ bullish for three consecutive sessions is a different setup than a single-session spike. The 3 Days view is especially useful before the open, when you want to check whether any names are carrying a persistent multi-session lean into the day.
Try this: Before the open, pull the 3 Days tab and check for names sitting at 70% or higher in one direction across multiple sessions. Those are worth having on a watchlist before the market opens.
Ticker search
Type a symbol to filter the visible cards. Press Enter to run a global search that fetches a card for that ticker even if it isn't in the currently rendered batch.
The "Showing N tickers (N rendered)" line
On October 1 this read "Showing 244 tickers (60 rendered)" with a green LIVE pill next to it. The page batches card rendering in groups of 60. Scroll down and the next batch loads. The LIVE pill confirms the data is streaming through the session.
Card anatomy
MU (Micron) sat at the top of the default sort on October 1. Let me walk through the card element by element.
Card header
207 trades, $1,432.96M total premium. That's the trade count and the aggregate premium before you read direction. High trade count with high premium means active, serious flow on this name.
The bull/bear bar
The colored bar under the header is the core visual. MU showed 74% bull / 26% bear. The green portion is bullish premium share. 74% means $1,054.29M of the $1,432.96M flowed into bullish fills. $378.67M went bearish.
That's a genuinely lopsided read. Compare it to SPY on the same day: 45% bull / 55% bear, a two-sided card, which is exactly what you'd expect from the world's most-traded options product where natural hedging runs both directions all day. The bar on SPY looks almost balanced. The bar on MU doesn't.
Bullish Flow and Bearish Flow rows
Below the bar you get the breakout:
MU on October 1:
- BULLISH FLOW: $1,054.29M / 98 trades
- BEARISH FLOW: $378.67M / 109 trades
The bearish side had more individual trades (109 vs 98) but far less total premium ($378M vs $1,054M). The bullish prints were larger on average. Fewer, bigger bets on the call side; more frequent, smaller bets on the put side. When you see that pattern on a single-name stock, you're generally looking at deliberate concentrated buying on one side and scattered activity on the other.
Premium is the better signal here, not trade count. Trade count alone can mislead: a name with 300 small trades looks busy, but 20 large ones can represent far more conviction.
Key point: When the bullish side has fewer trades but more total premium, you are looking at concentrated buying on one side and scattered activity on the other. That pattern is worth noting.
The biggest print row
The bottom of each card shows the single highest-premium print of the session for that ticker. On October 1, MU's showed:
CALL | GOLDEN_SWEEP | 0DTE | ITM +4.3% | (strike and expiry masked) | $129.85M | 10:26 AM
Each chip:
CALL or PUT: the type of the largest individual print. This isn't necessarily the same direction as the card's overall lean. It's just the biggest single trade.
Trade type chips: four labels appear here.
GOLDEN_SWEEP is the highest-bar flag on the platform. For a print to trigger this label, it needs to clear $2.5 million or more in premium AND show volume at least 5 times the existing open interest AND land within 15% of the current stock price, all three conditions at once. The $2.5M minimum is the first cut. The 5x volume-over-OI is the organized-execution signal. The within-15% requirement means it's not a cheap out-of-the-money lottery ticket. Most prints on the tape never come close to triggering all three.
SWEEP means the order was executed across multiple exchanges simultaneously, the standard signature of someone who wanted a fill immediately and was willing to accept market impact to get it. Aggressive execution.
BLOCK is a single large negotiated trade, often between institutional counterparties. These can be directional bets, but they're at least as likely to be hedges.
SPLIT is one large order broken into multiple prints to reduce market impact.
0DTE chip: marks options with 0 to 3 days to expiry. MU's biggest print was a $129.85M golden sweep in same-day calls. That's a massive gamma position. Whether it's a directional bet on an intraday catalyst or a hedge against something else is context the card doesn't provide on its own.
ITM / ATM / OTM and the moneyness percentage: ITM +4.3% means the strike was 4.3% in the money at the time of execution. ATM means at or very close to the current price. OTM means out of the money.
ATM and slightly ITM sweeps are generally the higher-conviction end. They cost more per contract and offer less leverage than deep OTM bets, so whoever's placing them is prioritizing a realistic payoff over a long-shot. Deep OTM prints can be cheap directional flyers or cheap tail-risk protection. The chip tells you which bucket you're in without doing the math manually.
For AMZN on October 1, the biggest print showed ITM +5.1%, a $15.58M CALL GOLDEN_SWEEP 0DTE. For AAPL it was a $19.69M CALL GOLDEN_SWEEP 0DTE ATM at 9:48 AM.
Strike and expiry: masked on the summary
You'll see dots where the actual strike and expiry would sit. The summary card is designed for a conviction read at a glance. To see every individual print with full strike, expiry, volume, and score visible, click the ticker and you land on the per-ticker flow tape.
Journal this flow / Watch this ticker
Two quick actions at the bottom. "Journal this flow" pre-loads a trade journal entry with the ticker and flow context. "Watch this ticker" adds it to your watchlist.
Two-sided cards versus lopsided ones
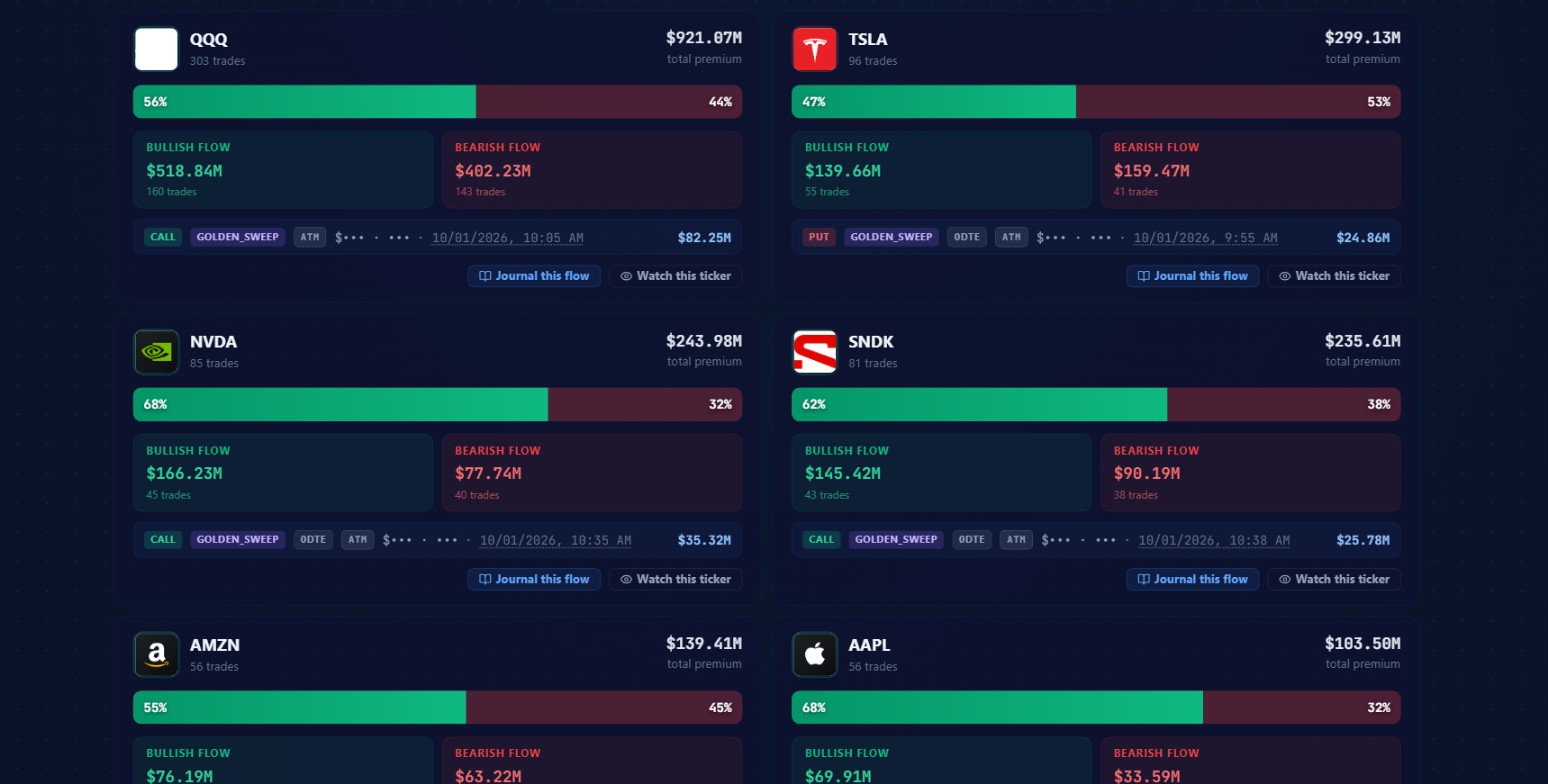 Four more cards from the same session. NVDA (68/32) and SNDK (62/38) show clean lopsided leans with moderate totals. AMZN (55/45) is nearly balanced despite sitting above them by total premium.
SPY's October 1 card: 45% bull / 55% bear, $1,145.36M total, 357 trades, biggest print a $141.10M CALL GOLDEN_SWEEP ATM at 9:45 AM.
A $141 million golden sweep in calls at 9:45 AM, sitting inside a net-bearish card for the session. How do you read that?
One possibility: the morning call sweep was a genuine directional bet and the rest of the session's SPY flow was dominated by put-buying hedges. Another: the $141M sweep was itself a hedge against a large short equity book. A third: a market maker delta-hedging short call positions. The card doesn't resolve which one it was.
This is the recurring reality with index ETFs. The mechanical hedging traffic on SPY and QQQ runs so heavily in both directions that conviction reads are always partial. A single large bullish print inside a net-bearish card is real data but limited data.
Watch out: Index ETFs run heavy hedging traffic in both directions all session. A single large bullish print inside a net-bearish SPY or QQQ card does not override the card direction. Single-name stocks give a cleaner read.
MU's 74/26 split is a different read. Over 207 trades and $1.43 billion in premium, three dollars flowed bullish for every dollar that went bearish. That's not hedging noise. That's consistent directional pressure built up across a full session of many separate trades.
Comparing AAPL and AMZN from the same session: AAPL came in at $103.50M and 68% bullish; AMZN at $139.41M and 55% bullish. AMZN had more absolute premium but AAPL had cleaner conviction. A sort by Total Premium buries AAPL below AMZN. A sort by Most Bullish surfaces AAPL above it.
NVDA that day: $243.98M, 85 trades, 68% bullish. SNDK: $235.61M, 81 trades, 62% bullish. Both are lopsided reads. Similar trade counts and similar dollar averages per trade, but NVDA's conviction reads cleaner at 68% versus SNDK's 62%. The directional difference is in the split, not the trade texture.
None of this is a formula. It's context that narrows how you should interpret the flow before you act on it.
How Flow Summary fits with the other flow pages
Six pages on TraderMatrix cover options flow. They answer different questions.
| Tool | What it surfaces | Use it when |
|---|---|---|
| Unusual Activity (guide) | Individual prints scored by the anomaly engine | You want specific prints that cleared a high-signal bar |
| Flow Summary (this page) | $20k+ flow per ticker, no score floor, directional lean baked in | You want the aggregate pulse across the whole tape |
| Heat Map (guide) | Sector-level flow as a visual grid | Confirming whether conviction on several names is a broader rotation |
| Sector Flow (guide) | Premium split by GICS sector | Checking if tech names dominating the page are a sector rotation or just a few mega-caps |
| Earnings Flow (guide) | Flow around earnings announcements | A name you spotted has an upcoming earnings date |
| Dark Pool (guide) | Large equity blocks executed off-exchange | You want a second data source on the same name from a different instrument |
A daily routine
Before the open
Pull the 3 Days tab. Check whether any names are carrying a multi-session lean. A ticker at 70%+ bullish for three consecutive sessions isn't a fluke; it's worth having on a watchlist before the open rather than discovering it mid-morning.
Also check the market bias bar from the prior close. If Yesterday ended at 60%+ bullish and pre-market flow is already trending the same way, you have a cleaner environment to look for bullish cards in.
9:30 to 10:00 AM
The first half hour is noisy. Market makers are positioning, indices are getting hedged, and 0DTE is churning through its opening mechanics. I watch the market bias bar settle and check whether any single name is drawing disproportionate flow relative to what I'd normally expect, but I don't act on flow reads this early.
10:00 AM onward
By 10 AM the first genuine directional flow has usually separated from the open-of-session mechanics. I'll sort to Most Bullish, flip on Hide 0DTE, and look for single-name stocks (not index ETFs) with both a meaningful lopsided percentage and significant absolute premium. Those are the names worth clicking through to the full per-ticker tape.
Mid-day (11:30 AM to 1:00 PM)
Often quieter. Good window to compare Today vs 3 Days on names that were interesting earlier. A name that ran 80% bullish for two days and is now showing a mixed card can mean the original thesis is playing out, or someone is unwinding. Either way it's worth noting before the afternoon session.
After 3:00 PM
Late-session flow has a different character from mid-day flow. A lot of it is end-of-day rebalancing, options hedges closing, and portfolio books squaring before overnight. A 3:50 PM golden sweep on SPY is more likely to be a delta-hedge rollover than a fresh directional bet. Late-session flow on single-name stocks is worth more scrutiny; a firm conviction print in the last hour on a specific name usually isn't book-squaring.
Common mistakes
Treating every golden sweep as a go signal
The golden sweep clears a high bar by design, but clearing that bar doesn't determine direction. The $141M CALL GOLDEN_SWEEP on SPY at 9:45 AM on October 1 was sitting inside a net-bearish day for SPY. A single print never tells the whole story; the card context and the market bias bar frame what the print means.
Not using Hide 0DTE
Every major name on October 1 had a 0DTE top print: MU, QQQ, TSLA, NVDA, SNDK, AAPL, AMZN. All of them. If you're building a multi-day thesis, flipping on Hide 0DTE gives you a materially different view of which names have longer-dated conviction behind them.
Reading only the top five cards
The default sort puts the heaviest-flow names first, and those tend to be index ETFs with mixed flow. AAPL at $103M and 68% bullish was sitting behind SPY, QQQ, MU, and several others by total premium. Scroll further, or use Most Bullish to surface the names where the lean is cleanest.
Taking high total premium as directional
$5.8 billion flowed on October 1. Most of it was SPY and QQQ, which together had over $2 billion in combined flow at roughly two-sided leans. Large total premium on a name isn't a signal; the percentage split is the signal. Premium size just tells you whether the signal is worth paying attention to.
Reading the card without checking the regime
A 90% bullish card on a name that's trading below its 200-day average on a Risk-Off day is a different proposition than the same card on a breakout name on a Risk-On day. The market bias bar and the risk composite strip at the top of the page are there for this reason. Check them before you read a card.
What the tool doesn't tell you
The cards show you what the premium said. They don't tell you why.
A $129.85M golden sweep on MU calls at 10:26 AM could be a fresh directional bet. It could also be a hedge against a short MU equity position, a covered call writer rolling strikes forward, or a market maker managing their delta book. The combination of card lean, trade structure, market regime, and the print's own characteristics narrows the possibilities, but it doesn't resolve them.
If you're seriously considering acting on a flow read, click through to the per-ticker tape. See what strikes they were buying, how those strikes sit relative to current price, and whether multiple prints are clustering at the same level across the session. Clustering at a specific strike across several separate trades is a much stronger signal than a single large print.
One thing I genuinely don't have a clean answer to yet: whether very large same-day golden sweeps, $100M+, should be treated differently from the 0DTE cohort's directional-follow-through pattern overall. The 0DTE cohort in aggregate underperforms longer-dated prints, but a $130M print isn't the median 0DTE trade. I haven't run that comparison. It's worth watching.
Using the drill-down
Click any card and you land on the per-ticker flow tape, which shows every individual print for that name with full strike, expiry, trade type, sentiment, volume, and score visible. That's where you actually build a thesis: see whether the top prints are clustering at a specific strike, check what DTE they're targeting, and look at whether the prints got more or less aggressive through the session.
The ticker search on the summary page doubles as a shortcut. If you're already watching a few names from an Unusual Activity alert or from a prior session's flow read, search for them directly rather than scrolling the full card grid.
The "+Add to My Desk" button at the top of the page adds Flow Summary as a tile to your My Desk layout. If this is part of your morning routine, having it on your desk means it loads the moment you log in.
For searching across ticker data and fundamentals alongside the flow picture, Ticker Search is the cross-reference tool. For the dealer-positioning picture on a name you've identified from flow, GEX shows you where the gamma exposure sits and what levels matter to market makers.
Options trading involves real risk of loss, including potentially more than the amount you put in. Nothing here is financial advice; it's an explanation of how the tools work and how to read the data they surface. Do your own research and manage your position sizing carefully, particularly on short-dated and same-day options where gamma risk is highest.