Loading...

Options Flow deep dive · 18 min read
Sector Flows
How to read institutional sector rotation, GEX wall breaks, and the options flow regime from a single dashboard.
Open the tool →Hey guys, Art from TraderMatrix here. If there's one page I keep open every morning before the market opens, it's this one. The Sector Flows dashboard doesn't do any one thing better than any other tool on the platform, but it's the only place where options flow, technicals, GEX structure, and rotation all talk to each other in the same view. Most mornings I make faster decisions here than I do anywhere else.
I want to walk you through every panel from top to bottom, explain how the numbers are computed, and be honest about where the data has limits. Let's get into it.
The short version:
- Flow scores aggregate from individual stock options across all sector-mapped tickers, not just the ETF chain itself.
- The Macro Hero and its regime badges are always today's data; the window toggle controls only the flow grid, the % Change column, and the Wall Breaks lookback.
- Wall Breaks track where dealer gamma structure shifted; CONFIRMED means price closed past the level and held for at least one session.
- The Rotation Map frames the multi-week thesis; use it to set context before you read the flow numbers, not after.
- One session of bullish flow against five bearish sessions tells a different story than five consecutive green bars.
Why sector-level positioning matters
Most options traders think ticker-by-ticker. You see an unusual flow alert, look up the stock, decide if you want to trade it. That works, but it misses context that changes your sizing and timing.
Institutional investors allocate capital across sectors based on the macro cycle. When they rotate from defensives (Utilities, Consumer Staples) into cyclicals (Technology, Industrials), they do it first in derivatives. Options are faster and more capital-efficient than buying or selling equity positions directly.
By the time a sector rotation shows up in ETF prices, it's already been accumulating in options premium for hours or days. That derivative flow is what this page tracks.
Key point: The flow scores here come from individual stock options mapped to each sector, not just the ETF options. When XLK shows large net flow, that's Apple, Nvidia, and Microsoft prints aggregated, not just XLK chain activity.
One thing worth getting clear before anything else: the flow scores you see here are built overwhelmingly from individual stock options, not the sector ETF options themselves. Every ticker in our database is mapped to a sector. When XLK shows a large positive net flow number, that's bullish premium minus bearish premium across every tech-mapped ticker that cleared the activity floor. Apple, Nvidia, Microsoft options. The ETF's own option prints count too when they qualify, but they're rarely the majority. You're getting a read on institutional positioning across the entire sector, not just the ETF chain overlay.
The page controls
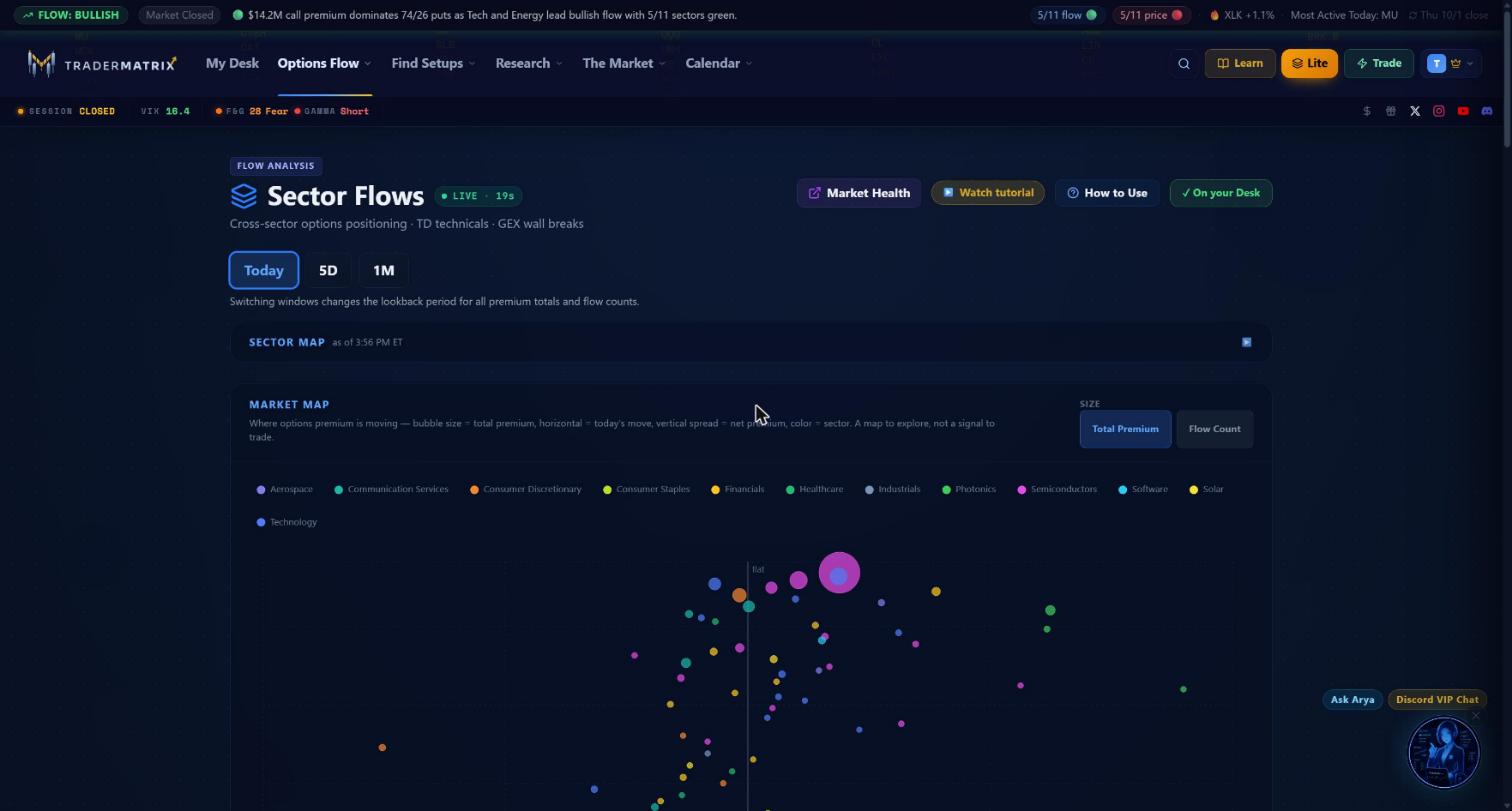 The page header and time window selector sit at the top. Just below is the collapsed Sector Map row. The Market Map scatter fills the lower portion, with the Size toggle visible on the right and the sector color legend below the chart.
The header row has four controls worth knowing: a link to Market Health, a Watch Tutorial button, a How to Use sidebar (the question mark icon), and an On your Desk button that pins the sector dashboard as a module on your My Desk layout.
Below the title is the time window selector: Today, 5D, and 1M. This controls more than most people realize.
What changes with the window: the flow totals and flow counts in the main grid (how far back in time the premium aggregation goes), the % Change column, and the Wall Breaks lookback.
What does not change with the window: the Macro Hero strip (always reflects today's data) and the Sector Rotation Map (runs on a fixed multi-year daily-close series with its own trail control). If you switch to 5D and the Macro Hero looks the same, that's why.
Directly below the window selector is the Sector Map row. It's a collapsible panel showing every tracked ETF as a sized, color-coded bubble grouped into Core sectors, Sub-sectors, and Thematic categories. The panel auto-opens during premarket and regular session hours and collapses after the close; click the header row to toggle it at any time. The "as of HH:MM ET" timestamp shows when the last snapshot was taken.
Watch out: The same sector can show opposite directional reads on Today vs 1M. A sector can spend a month with consistent bullish flow, then tip negative for two sessions, and Today will show bearish while 1M still shows bullish. I don't have a complete explanation for every case where that divergence shows up. Always check Today and 5D before drawing conclusions from one window alone.
The Sector Market Map
The Sector Market Map plots every tracked ETF at the intersection of its price movement (X-axis, labeled "1D Change %") and net options premium positioning (Y-axis).
The Y-axis is a ranked position, not a raw dollar figure. Raw net premium is heavily skewed (Technology dwarfs Utilities in absolute dollars), so a plain scale just packs everything into bands with a dead gap around zero. Instead, the chart ranks ETFs within the bullish group and bearish group separately, spreading them evenly across each half. The actual dollar figure shows in the tooltip when you hover.
Bubble size toggles between total premium and flow count. Total premium answers "where did the most money go?" Flow count answers "how many separate prints confirmed this?" I tend to use flow count when a sector has one massive whale print driving the number, because the count tells you whether it was actually broad activity or one outlier.
Click any sector label in the legend to isolate that sector's ETFs, which helps when you're comparing semiconductor vs. software positioning without the noise from other sectors.
The quadrant logic:
- Upper-right (price up, flow bullish): confirmation.
- Upper-left (price down, flow bullish): contrarian accumulation.
- Lower-right (price up, flow bearish): distribution. The most actionable quadrant because it runs against the price narrative.
- Lower-left (price down, flow bearish): outright bearish.
Try this: On any strong up day, check the lower-right quadrant. A sector showing bearish flow while price is rising means someone is paying for downside protection into strength. That divergence is worth tracking before you add directional exposure.
The Macro Hero
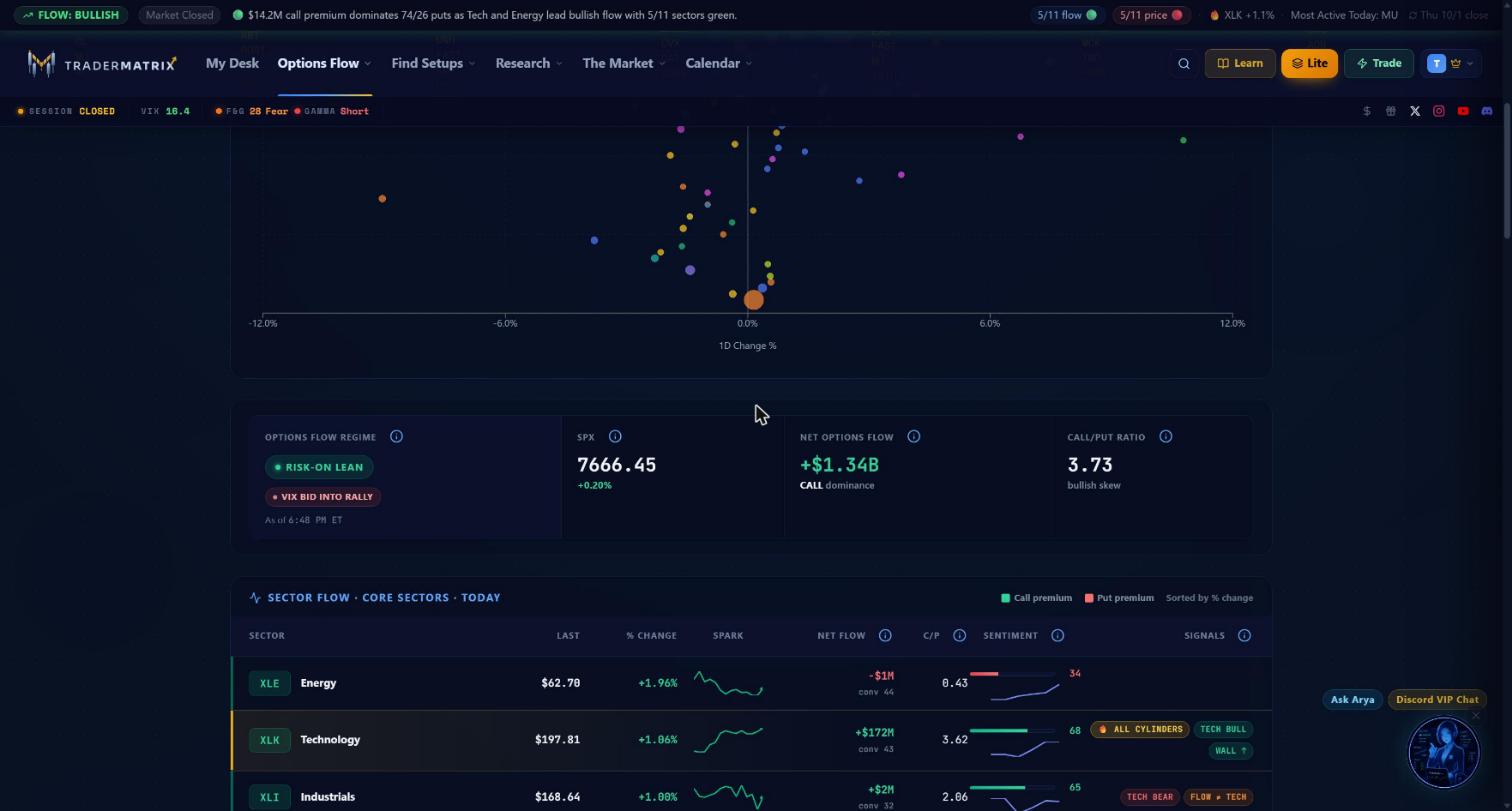 Macro Hero from October 1, 2026 after the close: RISK-ON LEAN with VIX BID INTO RALLY active at the same time, SPX 7666.45, net flow +$1.34B, C/P ratio 3.73. The VIX badge firing alongside the bullish regime is worth flagging.
The Macro Hero is a strip of four stat tiles: OPTIONS FLOW REGIME, SPX price, NET OPTIONS FLOW, and CALL/PUT RATIO.
OPTIONS FLOW REGIME is a rule-based classifier. The thresholds:
RISK-ON LEAN fires when net flow is positive and C/P ratio is above 1.18. RISK-OFF LEAN fires when net flow is negative and C/P ratio is below 0.85. CALL BIAS or PUT BIAS covers directional flow with a C/P ratio near balanced. MIXED FLOW means no clear directional bias.
This is the options flow regime only, not the site-wide Risk Composite. The Market Health page combines VIX, breadth, and additional signals. These are different lenses on the same market.
When the regime says RISK-ON but Market Health is still ELEVATED, that's worth noting. It could mean early institutional accumulation before headline indicators catch up, or a one-day positioning blip. The rotation map and wall breaks usually help resolve which.
There's also an optional divergence badge when a specific VIX-vs-SPX pattern appears. VIX BID INTO RALLY fires when SPX is up but VIX is also up. FEAR-LESS SELLOFF fires when SPX is down but VIX is flat or down. Both are secondary reads, not standalone signals.
These badges matter most when they appear alongside a directional regime. A RISK-ON LEAN with a simultaneous VIX BID INTO RALLY badge is internally inconsistent: call buyers are active but the options market is also pricing in fear. On October 1, 2026, the market closed with exactly that pairing: RISK-ON LEAN alongside VIX BID INTO RALLY, with SPX up 0.20% but VIX not falling. That combination is worth slowing down for, because it often precedes a fast reversal or a trap rather than follow-through.
Watch out: RISK-ON LEAN plus VIX BID INTO RALLY in the same strip is internally inconsistent. Call flow is bullish but fear is not falling. That pairing often precedes a reversal rather than follow-through. It is the regime combination worth pausing on most.
SPX shows the spot S&P 500 index level with the day's change. This tile doesn't change when you switch the time window.
NET OPTIONS FLOW is bullish premium minus bearish premium across all sectors, today only. Always reflects the current session regardless of the window toggle.
CALL/PUT RATIO is bullish premium divided by bearish premium. Above 1.18 triggers the bullish skew label; below 0.85 triggers put-dominant.
The Sector Flow Grids
Three grids here: Core Sectors, Sub-sectors, and Thematic. The core grid is the one everyone should understand first.
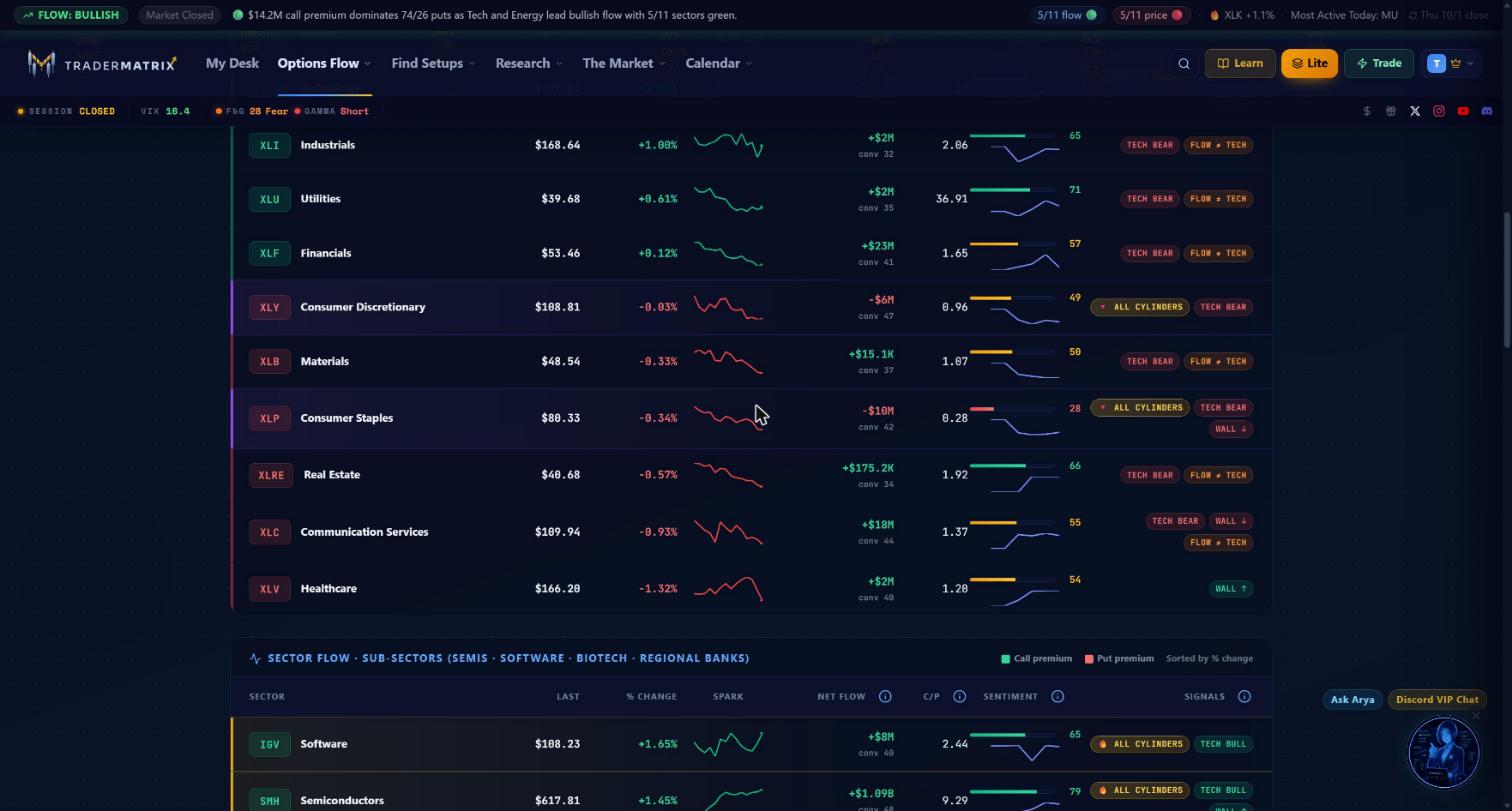 Core sectors grid showing the full 11 GICS sectors. XLP sits near the bottom with put-heavy flow and a sentiment reading in the red zone.
Core sectors (11 GICS)
| Sector | ETF |
|---|---|
| Technology | XLK |
| Health Care | XLV |
| Financials | XLF |
| Consumer Discretionary | XLY |
| Consumer Staples | XLP |
| Energy | XLE |
| Industrials | XLI |
| Materials | XLB |
| Utilities | XLU |
| Real Estate | XLRE |
| Communication Services | XLC |
Sorted by percent change descending.
Sector: The ETF symbol in green or red with the sector name below it. Most rows are clickable and link to the per-sector drill-down.
Last: The ETF's current price.
% Change: On the Today window, this is the ETF's intraday change. On 5D or 1M, it's derived from the daily-close sparkline (close 5 or 21 sessions back vs. the latest close). The data source changes with the window, which matters for how you read the number.
Spark: A small price sparkline. Green for positive movers, red for negative.
Net Flow: Bullish premium minus bearish premium in dollars for this sector over the selected window. A "conv 74" sub-label shows the average conviction score, which is the mean unusual-activity score across that sector's flows. Higher conviction means the underlying prints looked more institutional.
A sector with $50M net flow and average conviction 85 is very different from one with the same net flow but conviction 52. The second case often includes a mix of smaller prints piling on one side, and those tend to flush faster under pressure.
Key point: Check the conviction sub-label on Net Flow, not just the dollar total. Low conviction net flow is fragile. High conviction net flow at the same dollar size reflects more selective institutional activity.
On October 1, 2026, XLK showed +$172M net flow with C/P 3.62, sentiment at 68, and three signal pills lit: ALL CYLINDERS, TECH BULL, and WALL up. Consumer Staples (XLP) was the inverse: -$10M net flow, C/P 0.28, sentiment 28. Both are readable immediately from the grid without clicking through.
C/P: Call/Put premium ratio for this sector alone. Useful alongside Net Flow: if Net Flow is slightly positive but C/P is 2.4, call dominance is more pronounced than the net dollar figure suggests on its own.
Sentiment: A horizontal bar from red through amber to green. The raw formula is (bullish premium minus bearish premium) divided by total premium, times 100, giving a range of -100 to +100. The bar converts that to 0-100 via (raw + 100) / 2, centering at 50. Green at 60 or above, red at 40 or below, amber in between. Below the main bar, a thin indigo sparkline shows how sentiment shifted through the session when there's enough intraday data.
Signals: Inline color-coded pills summarizing confluences. TECH BULL and TECH BEAR mean the TraderMatrix TD Oscillator and Volume trend both confirm that directional read on the ETF. A WALL pill means a GEX wall break event is active for this sector; hover it for the level and confidence. ALL CYLINDERS (the fire pill) fires when flow, technicals, and price all point the same direction with no contradictions. Divergence tags show when this sector's flow doesn't match broader market behavior.
Sub-sectors and Thematic
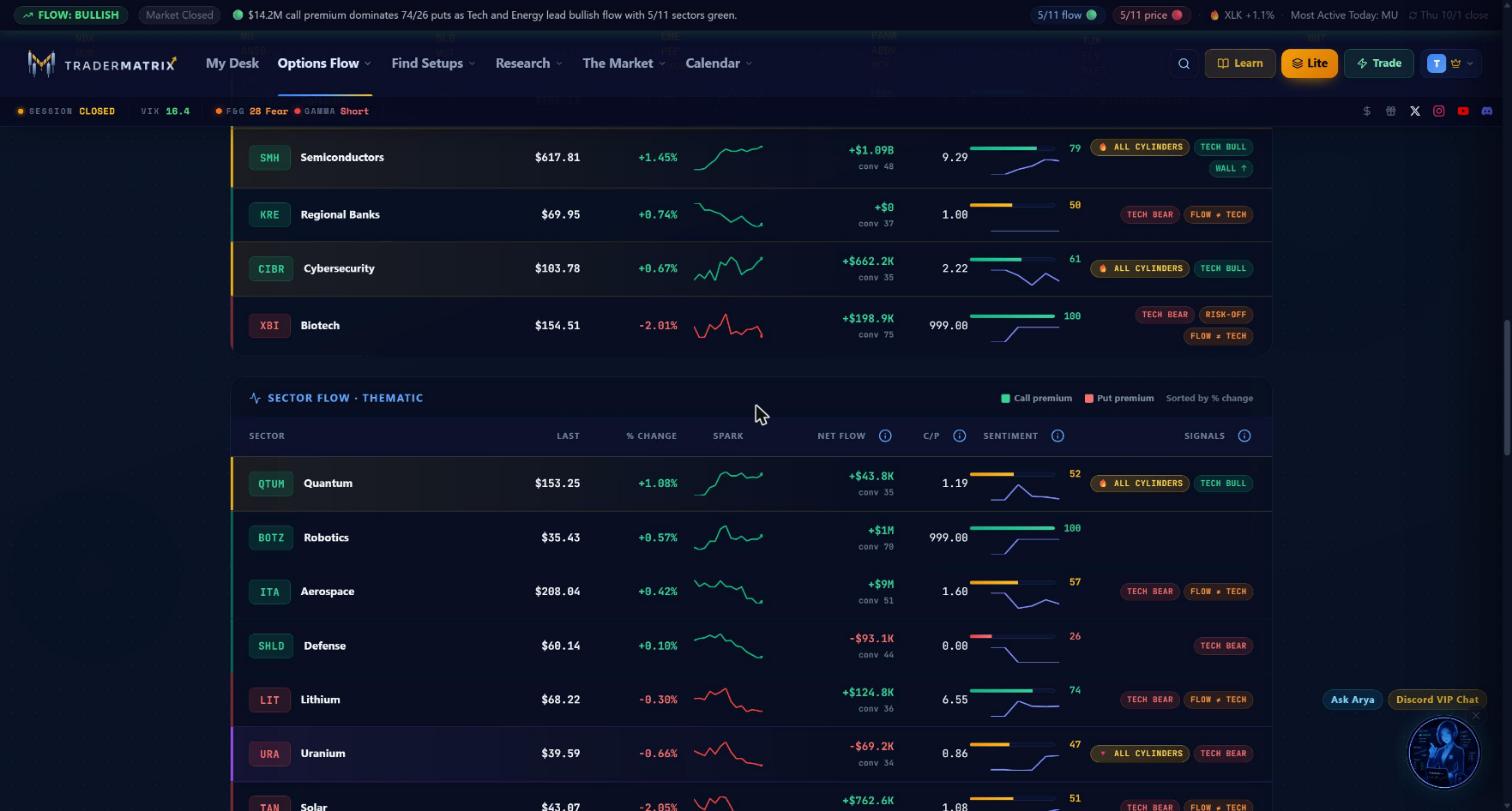 Sub-sector and thematic grids from October 1, 2026. SMH shows +$1.09B net flow, C/P 9.29, sentiment 79. XBI reads C/P 999.00 and sentiment 100 because zero put premium was recorded in the biotech flow that session.
Sub-sectors (5 ETFs): Semiconductors (SMH), Software (IGV), Biotech (XBI), Regional Banks (KRE), Cybersecurity (CIBR). These sit inside Technology, Health Care, or Financials in the GICS hierarchy but often move completely differently from the parent. Tech as a whole can be flat while Semiconductors is seeing heavy bullish flow from AI names. I check sub-sectors before core sectors when there's a clear thematic catalyst running. SMH had $1.09B net flow on October 1, 2026 with C/P 9.29 and sentiment 79, well ahead of broader Technology.
A word on the XBI row: C/P 999.00 and sentiment 100 are not a data error. When a sector has zero put premium recorded in the window, the platform caps the C/P ratio at 999 rather than displaying Infinity. The sentiment bar follows from that math (all bullish premium, no bearish, so raw score = +100, visual = 100). This is accurate but worth reading with appropriate skepticism: the number is extreme because the activity sample is very small, not because of some massive institutional conviction bet. Always drill down before acting on a sentinel-capped reading.
Thematic sectors (9): Defense, Aerospace, Robotics, Drones, Quantum, Solar, Uranium, Lithium, Photonics. These cut across GICS boundaries. Not every thematic row has a liquid single ETF, so some rows won't be clickable for the drill-down.
These matter most when a specific macro theme is active. When Congress passes a defense spending bill, the Defense thematic row often shows call premium before the mainstream sector flow picks it up. Quantum and Photonics tend to move when AI data-center capacity announcements hit. When market days get weird and I'm not sure what's driving things, this is the grid I check first.
Wall Breaks
Below the sector grids is the Wall Breaks panel. This is my favorite part of the page.
A GEX wall is a price level where dealer gamma exposure is concentrated. When a sector ETF closes through a dealer's call gamma wall or put gamma support, dealer hedging behavior shifts character. Below a call wall, dealers are long gamma and dampen volatility. Above it, they go short gamma, which amplifies moves. These transitions matter for options positioning because they change the risk/reward on directional bets in that ETF.
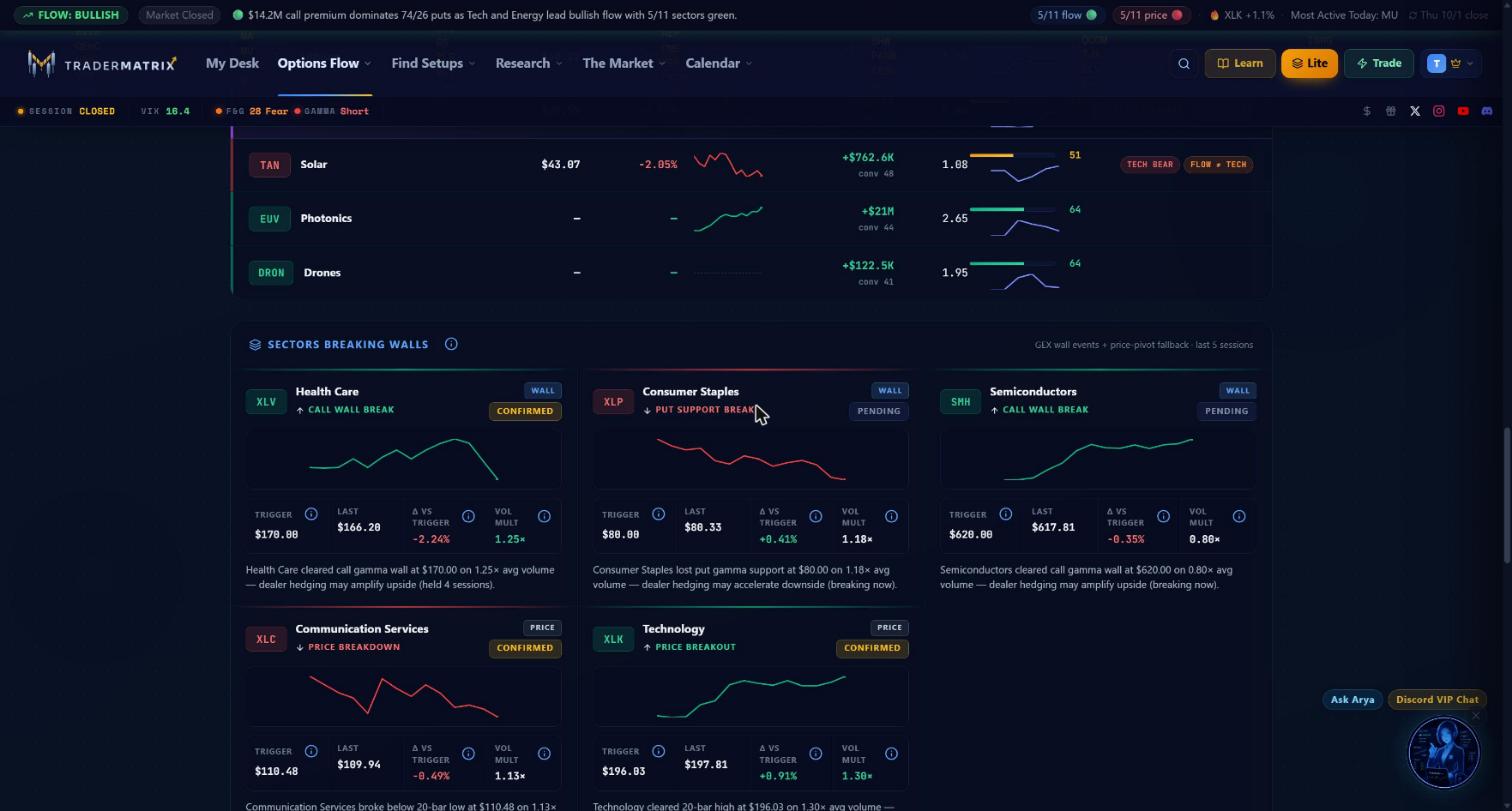 Wall Breaks panel from October 1, 2026 after the close. XLV and XLK show CONFIRMED status, meaning price closed past the wall and held. XLP and SMH are PENDING, within 0.5% of their respective walls but not through yet.
The panel shows two event types: WALL (the ETF closed through a dealer GEX wall) and PRICE (a classic price-pivot breakout or breakdown, used when GEX wall events are sparse so the panel always has signal).
Each card shows: event type, direction arrow, confidence badge, a sparkline of recent price action, trigger level, last price, delta vs trigger (percentage distance past the level), and vol multiplier (today's ETF volume divided by 20-day average).
Confidence ladder
| Status | Condition |
|---|---|
| IN_MOTION | Within 0.3% of a wall during market hours, not yet crossed. Most time-sensitive. |
| PENDING | Within 0.5% of a wall, not yet crossed. One large candle away. |
| CONFIRMED | Closed past the wall, held for at least one session. |
| STRONG | CONFIRMED plus the break day had 1.5x or more average volume. |
When IN_MOTION fires, pull up the drill-down for that sector and check whether the flow over the most recent window is building in the direction of the break, or fading into resistance.
On October 1, 2026, the panel showed five active events simultaneously: XLV and XLK with CONFIRMED breaks, XLP and SMH at PENDING (within striking distance but not through yet), and XLC with a PRICE BREAKDOWN CONFIRMED. Cross-referencing with the flow grid: XLP was already showing -$10M net flow and C/P 0.28, so the put-dominant options activity and the PENDING wall event were both pointing the same direction.
Key point: A wall break that lines up with the sector's existing flow direction is reinforcing. A CONFIRMED break running against the prevailing flow is worth treating skeptically until price confirms and holds.
A word on the PRICE badge: it appears when GEX wall events are absent but the platform still surfaces a relevant price action signal. It's not the same type of signal as a dealer wall break. Read them differently.
The Sector Rotation Map
The RRG, the Relative Rotation Graph, shares a slot with the Market Map: flip the Market Map / Rotation Map switch above the Deep dive to bring it up. The most underrated part of the page.
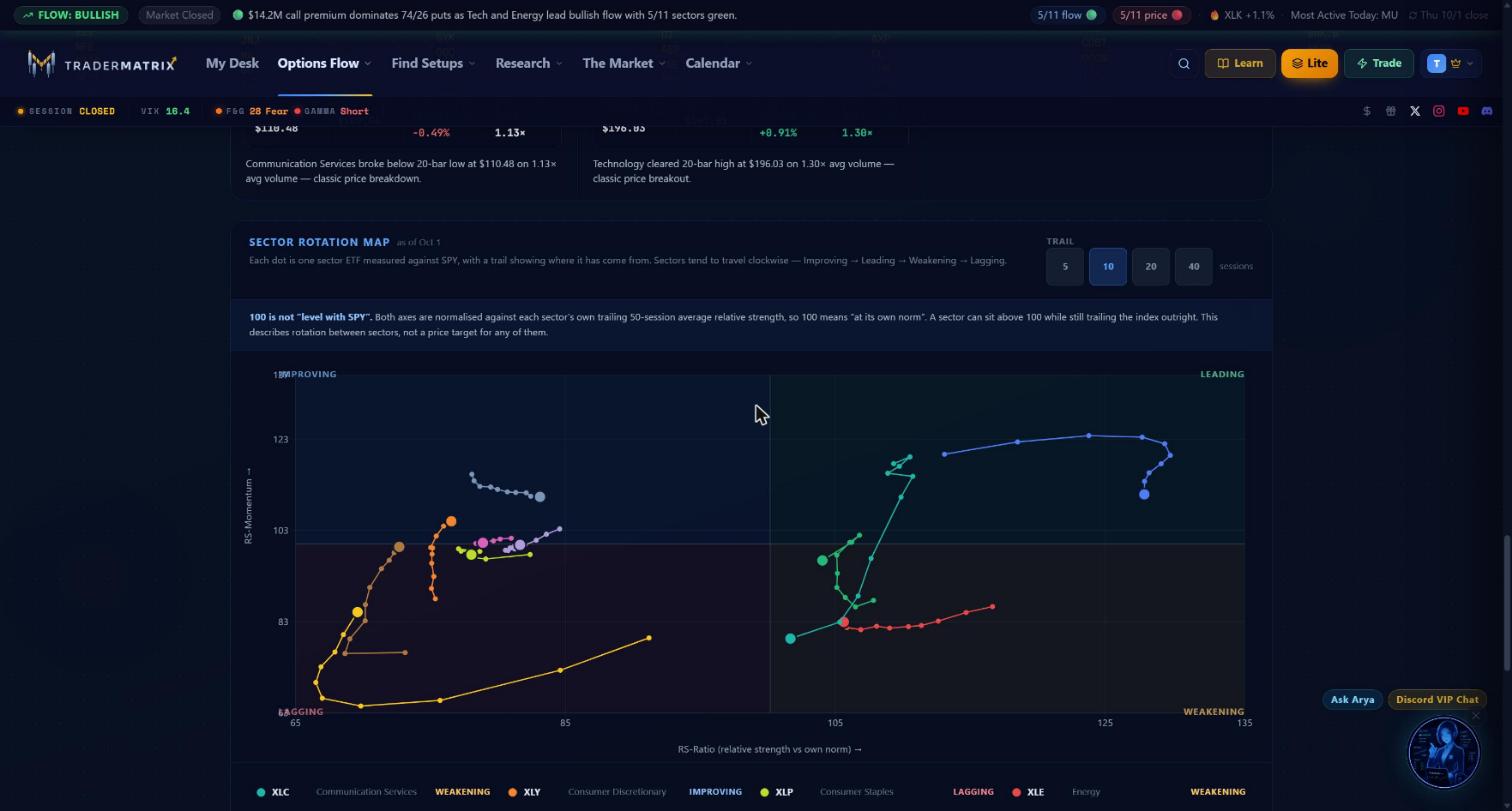 Sector Rotation Map as of October 1, 2026. The note at the top is important: 100 is each sector's own average, not SPY. A sector at 102 on both axes is outperforming its own recent average, not outperforming the market by 2%.
The RRG measures each sector's performance against SPX on two dimensions: relative strength (X-axis, RS Ratio) and relative momentum (Y-axis, RS Momentum). Both axes are normalized so that 100 means "at its own recent 50-session average." Above 100 means above that average; below 100 means below it.
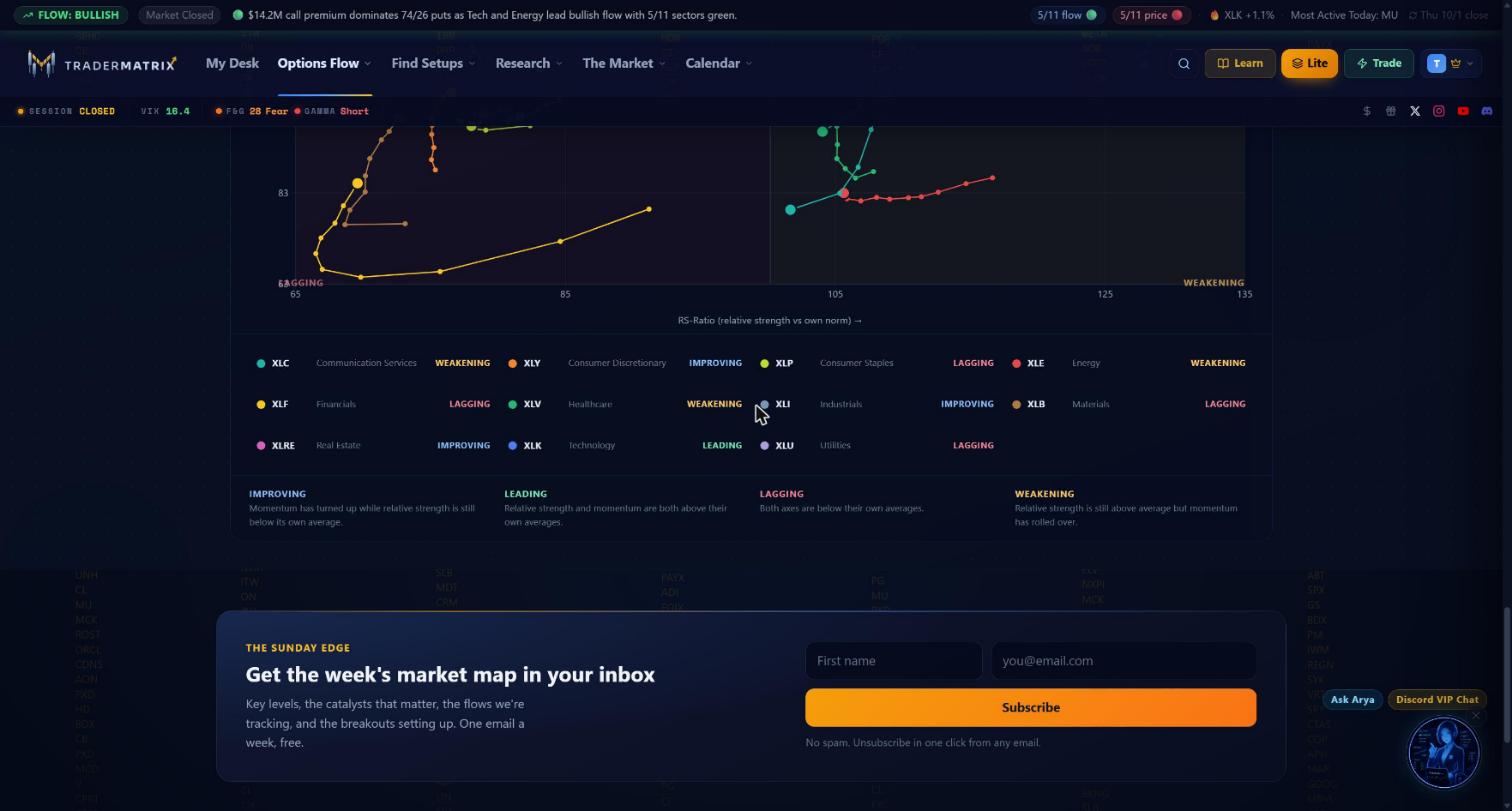 Rotation map legend and quadrant definitions.
Four quadrants:
Improving (top-left): momentum has turned up while relative strength is still below its own average. Early-stage rotation back in. Watch for call accumulation here.
Leading (top-right): relative strength and momentum are both above their own averages. Sector outperforming and the trend accelerating. This is where you want call exposure.
Weakening (bottom-right): relative strength is still above average but momentum has rolled over. Former leaders losing steam. Early put accumulation often shows up in the flow grid before the sector fully rotates out.
Lagging (bottom-left): both below average. Underperforming with momentum going the wrong direction.
Standard RRG cycle is clockwise: Improving, then Leading, then Weakening, then Lagging, back to Improving. The trail behind each dot tells you the path, which is as important as the current position. A sector just entering Leading from Improving is in a different spot than one that's been in Leading for 20 sessions and is about to tip into Weakening.
Trail length selector at the top: 5, 10, 20, or 40 sessions (default 10). The Today/5D/1M window toggle does not affect this chart.
I use the RRG mostly to frame the thesis, not to time entries. If a sector is deep in Lagging with no visible trail turning toward Improving, I need a strong reason to take bullish sector-level exposure regardless of what the flow grid shows.
Try this: Before checking today's flow grid, glance at the Rotation Map first. A sector entering Improving with early bullish flow in the grid is an early-rotation setup. A sector already deep in Weakening with bearish flow is a fade setup. The map sets the frame; the grid fills it in.
Drilling into a single sector
Click any row in the flow grids to open the per-sector detail page. You'll see every unusual options print captured for that sector's constituents during the selected window.
Filter options: minimum premium ($20K, $50K, $100K, $250K, $500K), option type (all, CALL, PUT), sentiment (all, Bullish, Bearish, Neutral). Sort by premium descending or ascending, conviction score, or time.
Total premium and flow count live here, not in the main grid. The grid shows net flow and C/P ratio. When you want to know how much total premium actually traded across a sector, this is where you find it.
Practical routine
Morning before the open: expand the Sector Map row if it's showing premarket data to see which sectors are gapping. Look at the Macro Hero for the prior session's final regime and any VIX divergence badges. Scan the flow grid to see whether the gapping sectors show confirming flow or are running into put-heavy conditions.
During the session: switch to Today. Check the Market Map for distribution signals (lower-right quadrant). Check Wall Breaks when a sector move feels outsized. When ALL CYLINDERS fires on a sector, stop for that one.
Finding a specific trade: strong bullish flow, strong technicals, STRONG or CONFIRMED wall break. Then go to Unusual Activity and find the specific tickers within that sector with large prints. That's the top-down to bottom-up pipeline.
End of day: switch to 5D and check whether the sector flow you saw today holds pattern with the prior week, or looks like a one-day blip against a longer trend running the other way. A single session of bullish flow in a sector that's been net negative for five days tells a different story than a fifth consecutive green bar.
What this pairs with
Unusual Activity: for specific tickers after you have a sector thesis. Start here, finish there.
Live Flow: a per-ticker roll-up of the $20K-plus options tape. Each card shows total premium, trade count, bull/bear split, and the latest large print for that ticker. Use it to check whether the flow you see in the sector grid is concentrated in one or two names, or genuinely broad.
Heat Map: faster visual scan of market activity by premium or flow count. Less depth than Sector Flows but quicker to scan.
Earnings Flow: specifically for positioning around upcoming earnings, not general rotation.
Dark Pool: large institutional equity prints (not options). Confirms when options positioning is backed by block equity activity.
The combination I keep coming back to: Sector Flows paired with GEX. When the GEX page shows SPX just below a major call gamma wall and Sector Flows shows RISK-ON LEAN with strong upside flow in Technology and Industrials, the structure and the positioning are both pointing the same direction. The Wall Breaks panel here is essentially the sector-ETF version of that same GEX concept.
Common mistakes
Treating one large hedge as a directional call. The most common error on this page. One large fund buying puts on XLF to hedge its bank-stock portfolio creates enormous bearish sector flow with zero predictive value for direction. If flow is bearish but the TD Oscillator is bullish, the flow is likely hedging. The signal pills often show this directly with a divergence tag.
Reading the sentiment bar as a raw number. The bar is centered at 50. A reading of 52 is noise. The actionable zone is above 60 or below 40. Beyond 70 or under 30 is where it becomes meaningful.
Watch out: The sentiment bar resets with the window. A sector at 68 on the Today window might read 45 on 5D if a single strong session is inflating today's number. Cross-check windows before treating sentiment as a trend.
Anchoring to one window. A sector showing strong positive net flow on 1M might have turned bearish in the last week. Check Today and 5D before drawing conclusions.
Using grid sort as a ranking of signal strength. The grid sorts by % change, not signal quality. Energy at the top just means it moved the most.
Using the RRG as a day-trade trigger. It shows relative performance over weeks or months. Frame your thesis with it, not your entries.
Scope and limits
Flow scores aggregate across every ticker mapped to a sector that cleared the unusual-activity detection threshold. Prints below the minimum premium floor and prints that read as institutional closes (rather than opens) don't factor in.
On Wall Breaks: a CONFIRMED break at a GEX level is not a guarantee of follow-through. Sectors can reverse back through a wall, especially around major macro events or OPEX.
Thematic sectors have fewer tickers. A single large print in a Uranium name can swing that row's sentiment score substantially. Use the drill-down to check whether the signal is one outlier or broad-based accumulation.
Options trading involves real risk. Flow data shows positioning, not outcomes. None of this is financial advice.