Loading...

Options Flow deep dive · 22 min read
How to Read the Dark Pool Page
A plain-English guide to off-exchange block prints on TraderMatrix: what the data actually contains, how the lean is calculated, and how to use it without falling into the most common traps.
Open the tool →Hey guys, Art from TraderMatrix here. Today we're walking through the Dark Pool page, and I want to do it properly because this is probably the most misunderstood feed in retail trading.
Before we get into the page itself, I need to explain what dark pools actually are and what this data does and doesn't show you. Skip this section and you'll almost certainly read the numbers wrong. I've seen it happen constantly.
The short version:
- ACCUMULATION and DISTRIBUTION are inferred from each print's price vs the prior session's close. No aggressor side is published. The platform does not know who was buying or selling.
- Block prints must clear $1M notional and a share or ADV threshold. The universe is 50 names only.
- The 10-session sparkline is the most important column on the board. A single day of lean is noise; ten consistent sessions means something.
- DISTRIBUTION is not a short signal. A desk working a sell order often holds a bid under the stock while doing it.
- Match your trade timeframe to the data. Dark pool prints reflect weeks-to-months positioning, not this afternoon.
What dark pools actually are
When a fund needs to buy four million shares of something, sending that order to the open market is basically announcing your intentions before you've done anything. The price runs away from you. Every algo and market maker sees the order flow and the spread widens, the ask lifts, and by the time you're filled your average is way worse than the quote you saw when you decided to trade.
So large institutions trade off-exchange instead. They use alternative trading systems, dark pools, and wholesalers who internalize the orders away from public exchanges. The trade still happens, it just doesn't show up on the lit tape until it's been executed. The stock doesn't move the same way a market order would, because the other side of the trade was negotiated separately.
Here's the part that matters for us: those trades still have to be reported. FINRA requires all off-exchange trades to be reported to a Trade Reporting Facility within seconds. Those reports get published on the consolidated SIP tape with exchange code "D," which is the FINRA TRF/ADF proxy. That "D" code is how the platform identifies off-exchange prints.
So yes, the data is real. These are actual trades that actually cleared. What we don't get is the venue and we don't get who initiated. The raw report tells us: price, size, time, and the fact that it was off-exchange. That's it.
The myth worth addressing
Finance social media has turned dark pool data into something it isn't. "The dark pool bought 10 million shares of XYZ." Nobody knows that. FINRA doesn't publish that. There's no buy/sell flag in the data because nobody agreed to publish one. What exists is a transaction that cleared off-exchange. One side bought, one side sold, we don't know which was initiating.
The "accumulation" and "distribution" you see on the page are inferred by comparing each print's execution price against the prior session's close. A print above that reference gets labeled accumulation. Below it, distribution. Prints within about 5 basis points of the close fall into a neutral deadband and get excluded from the net lean entirely.
That's a reasonable heuristic. Over a large enough sample it tends to track what positioning is actually happening. But it's an inference, not a report. When I say the page shows NVDA with +$123.8M accumulation lean, I mean more notional cleared above the prior close than below it. I don't mean "a fund bought $123.8M of NVDA." Those are different statements and only one of them is true.
Watch out: ACCUMULATION means more notional cleared above the prior close than below it. It does not mean a fund was buying. One side bought and one side sold on every print; the platform does not know which was initiating.
What the feed actually covers
Another thing to know: the "D" exchange code doesn't mean "institutional only." It means all off-exchange. Retail orders that get internalized by a market maker also hit this tape. They usually won't clear the block floor, but the distinction matters because you need to understand what you're looking at.
The page filters to block prints specifically. To qualify as a block, a print needs at minimum $1M in notional AND either 10,000 shares or 0.3% of the stock's 30-day average daily volume. That ADV branch exists for thinner names where a flat share count would miss genuinely large prints.
The universe covers 50 names: the 25 most liquid equities in the platform's directional flow tracking plus 25 more of the highest dollar-volume names added in September 2026.
Key point: Everything on the page comes from this 50-name universe only. If a name isn't in those 50, it won't appear here regardless of how much off-exchange activity it has. Use this page for the names it covers, not as a universal signal generator.
The page, top to bottom
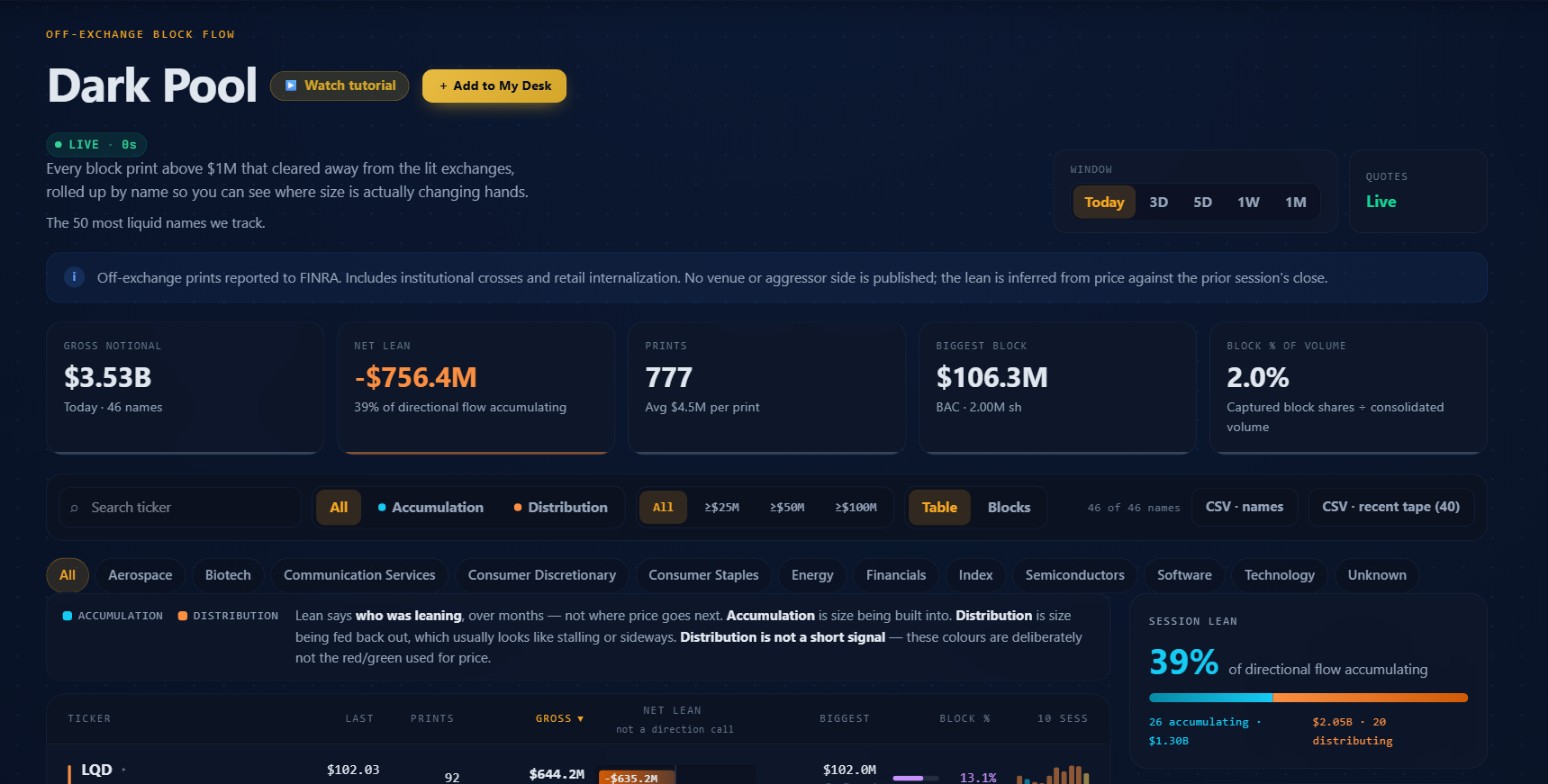 The full Dark Pool page after the close on October 1, 2026. Gross notional $3.53B across 46 names, net lean -$756.4M, 39% of directional flow accumulating.
The header and notice
The page opens with "OFF-EXCHANGE BLOCK FLOW / Dark Pool" and a subtitle explaining the filtering criteria: every block print above $1M that cleared away from the lit exchanges, rolled up by name. Below the title there's a notice bar that reads: "Off-exchange prints reported to FINRA. Includes institutional crosses and retail internalization. No venue or aggressor side is published; the lean is inferred from price against the prior session's close."
That notice is the most important text on the page. It's there because we want you to read it before you start trading off these numbers. The lean is inferred. No aggressor side. Those two facts change how you should use everything that follows.
The window toggle
Top right of the header area you'll see the window picker: Today, 3D, 5D, 1W, 1M. This controls what time range the board aggregates across. Today is usually where you start.
One thing to know: Block % of Volume only shows on the Today window. On any other window it shows as a dash. That metric is block shares divided by consolidated share volume, and consolidated volume only makes sense as a same-session metric. On a multi-day window you'd be dividing shares from different days against a number that doesn't span them cleanly, so the page just doesn't show it.
The 10-session sparkline column in the table is independent of whatever window you've selected. It always shows the last 10 trading sessions. Not 10 calendar days, 10 actual trading sessions.
The five stat tiles
Across the top of the board you get five summary tiles. On October 1, 2026 they showed:
| Tile | Value | What it means |
|---|---|---|
| Gross notional | $3.53B | Total notional across all block prints for 46 names this session |
| Net lean | -$756.4M | Accumulation notional minus distribution notional (neutral excluded); 39% of directional flow was accumulating |
| Prints | 777 | Total block prints, averaging $4.5M per print |
| Biggest block | $106.3M | BAC, 2.00M shares - the single largest print of the session |
| Block % of volume | 2.0% | Captured block shares divided by consolidated volume across the universe |
Key point: The "39% of directional flow accumulating" figure under Net lean excludes the neutral deadband entirely. Only prints that cleared more than 5 basis points above or below the prior close count as directional. That percentage tells you which way the classified prints leaned, not what fraction of all prints were accumulating.
The Net lean tile deserves an extra second. The percentage underneath it says "39% of directional flow accumulating." The denominator there is only directional flow, meaning prints that resolved to accumulation or distribution. The neutral deadband prints are excluded. So when you see 39%, you're reading: of the prints that cleared far enough from the prior close to get classified, 39% cleared above it. That's a minority of prints, but it's what the lean math actually measures.
The filter bar
Below the stat tiles you get the filter bar. Left to right:
A text search for ticker. Then lean chips: All, Accumulation, Distribution. The lean chip filters down to rows whose net notional is positive (accumulation) or negative (distribution). A flat row shows only under All.
Then size floor chips: All, >=$25M, >=$50M, >=$100M. These filter rows by total gross notional, not by individual print size. So a row needs $100M+ in gross to show under that last chip.
Then view toggle: Table and Blocks. More on Blocks in a bit.
After that, a count showing how many names pass your filters, then two CSV export buttons. "CSV - names" exports the board summary (one row per ticker). "CSV - recent tape" exports the actual print-level records from the block tape, with price, size, notional, lean, and timestamp per print. The tape export is how you find price clusters when you want to know where size actually transacted.
The row of sector chips below the filter bar lets you filter by sector. October 1 showed: All, Aerospace, Biotech, Communication Services, Consumer Discretionary, Consumer Staples, Energy, Financials, Index, Semiconductors, Software, Technology, Unknown. Click one and the table filters to just that sector. Click it again to go back to All.
The table
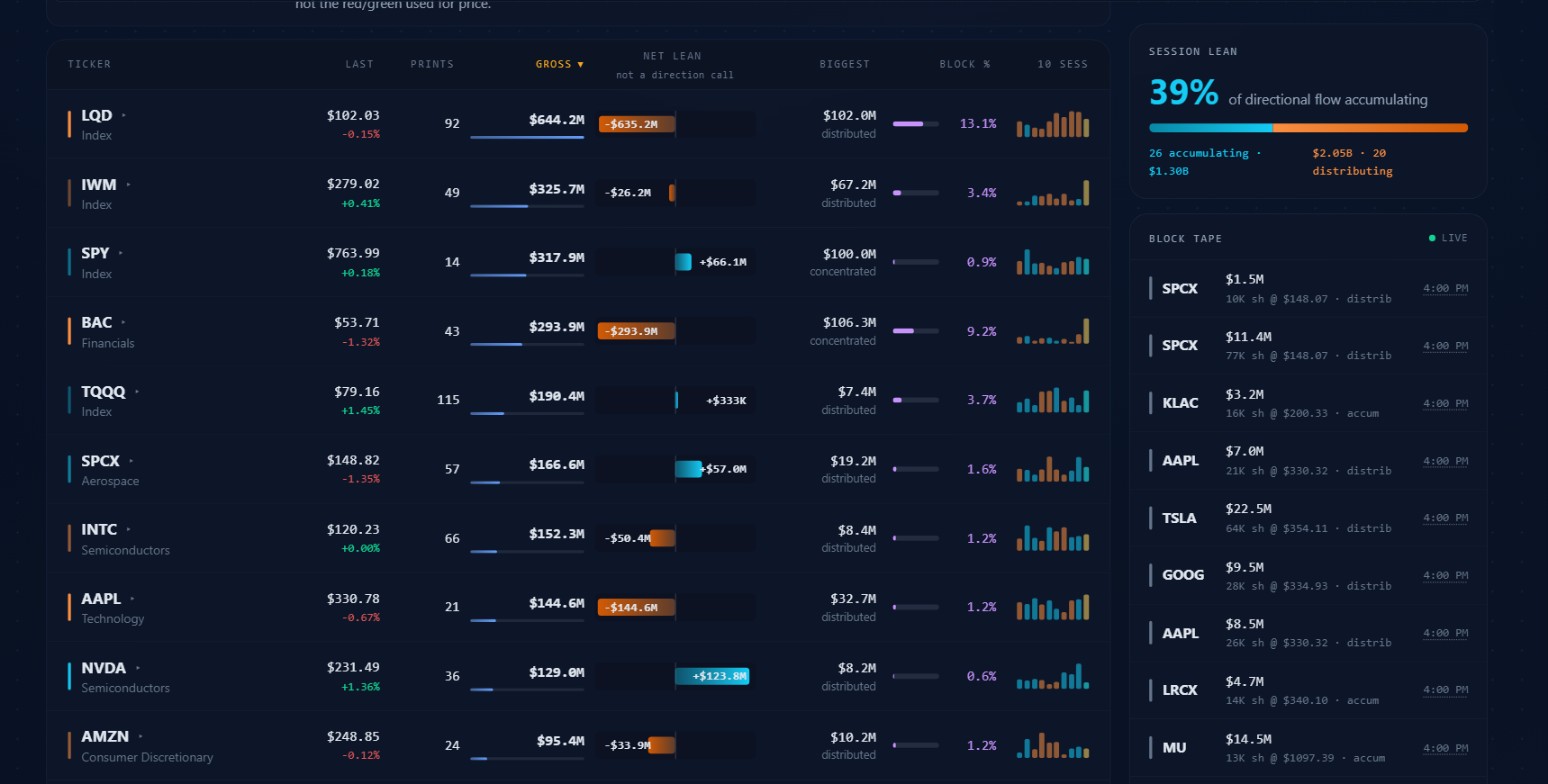 Table rows from the October 1 session sorted by gross notional descending. LQD tops the board at $644.2M gross with a -$635.2M distribution lean.
The table columns:
Ticker and sector - The name and its sector classification. Every name in the universe gets a sector tag. Some show "Unknown" when the mapping hasn't been resolved.
Last - The last traded price plus the day's percentage change.
Prints - How many block prints cleared for this name in the selected window.
Gross - Total notional for the window. A bar underneath it scales against the board maximum, so you can visually see which names are dominating. The bar fill also takes on the lean color so the column reads as both a size and a direction indicator at once.
Net lean - The lean badge (ACCUMULATION or DISTRIBUTION) and the net notional number below it. Neutral rows don't show a badge. The lean colors are deliberately not red and green. Cyan for accumulation, orange for distribution. That choice is intentional: every other price-related column on the platform uses red/green, and this lean is not a price signal. The platform's own primer on the page puts it this way: "Distribution is not a short signal - these colours are deliberately not the red/green used for price."
Biggest - The size of the largest single print. Also shows a "concentrated" or "distributed" label. A concentrated label means most of the gross came from a small number of large prints. Distributed means the gross was spread across many smaller ones. That distinction matters because a single desk working size looks concentrated, while broad participation looks spread out.
Block % - Block shares as a percentage of consolidated volume. Only shows on the Today window. This is the column that puts gross notional in context. A name with $300M in gross but 0.9% block share is just Tuesday for that instrument. A name with $152M in gross and 1.2% block share needs more attention.
10 sess - A sparkline of the lean across the last 10 trading sessions. Ten colored bars showing the trend over two weeks.
Key point: The 10-session sparkline is the column I come back to most. A single day of accumulation lean is noise. Ten sessions of consistent accumulation lean means somebody has been building for two weeks and they can't hide the footprint completely. A fresh one-day spike means nothing until it holds.
Looking at the October 1 table
LQD (the iShares investment-grade bond ETF) sat at the top of the board with $644.2M in gross, a heavy -$635.2M distribution lean across 92 prints, and $102.0M for its biggest block. Block share was 13.1% of consolidated volume. That's genuinely large for LQD. Whether you do anything with that information depends on your thesis and timeframe, but it's not a number you ignore.
IWM had $325.7M in gross, -$26.2M lean (mild distribution), 49 prints, and $67.2M biggest. Block share 3.4%. Compared to LQD, the lean is weak relative to the gross.
SPY had $317.9M gross, +$66.1M lean (accumulation), 14 prints at $100.0M biggest. Block share 0.9%. For SPY that block share is basically background noise. SPY moves enormous off-exchange volume every single day and most of it expresses no directional view at all. The concentration label matters here: "concentrated" means those 14 prints were large individual crosses. But with 0.9% block share, it's still not a meaningful read.
BAC had $293.9M gross, a -$293.9M distribution lean, and the session's biggest single block at $106.3M from 43 prints. Block share 9.2%. BAC is interesting because the distribution lean equals the gross almost exactly, meaning essentially all the directional notional cleared below the prior close. And that $106.3M single print at 2.00M shares is the biggest single transaction the platform captured that entire session.
NVDA had $129.0M gross and +$123.8M net lean, meaning almost all of its directional notional cleared as accumulation. 36 prints. Block share 0.6%. That's a narrow universe for NVDA. But the heavily skewed lean in accumulation territory is the kind of print distribution you'd want to see if you were watching NVDA for a thesis.
Expanding a row
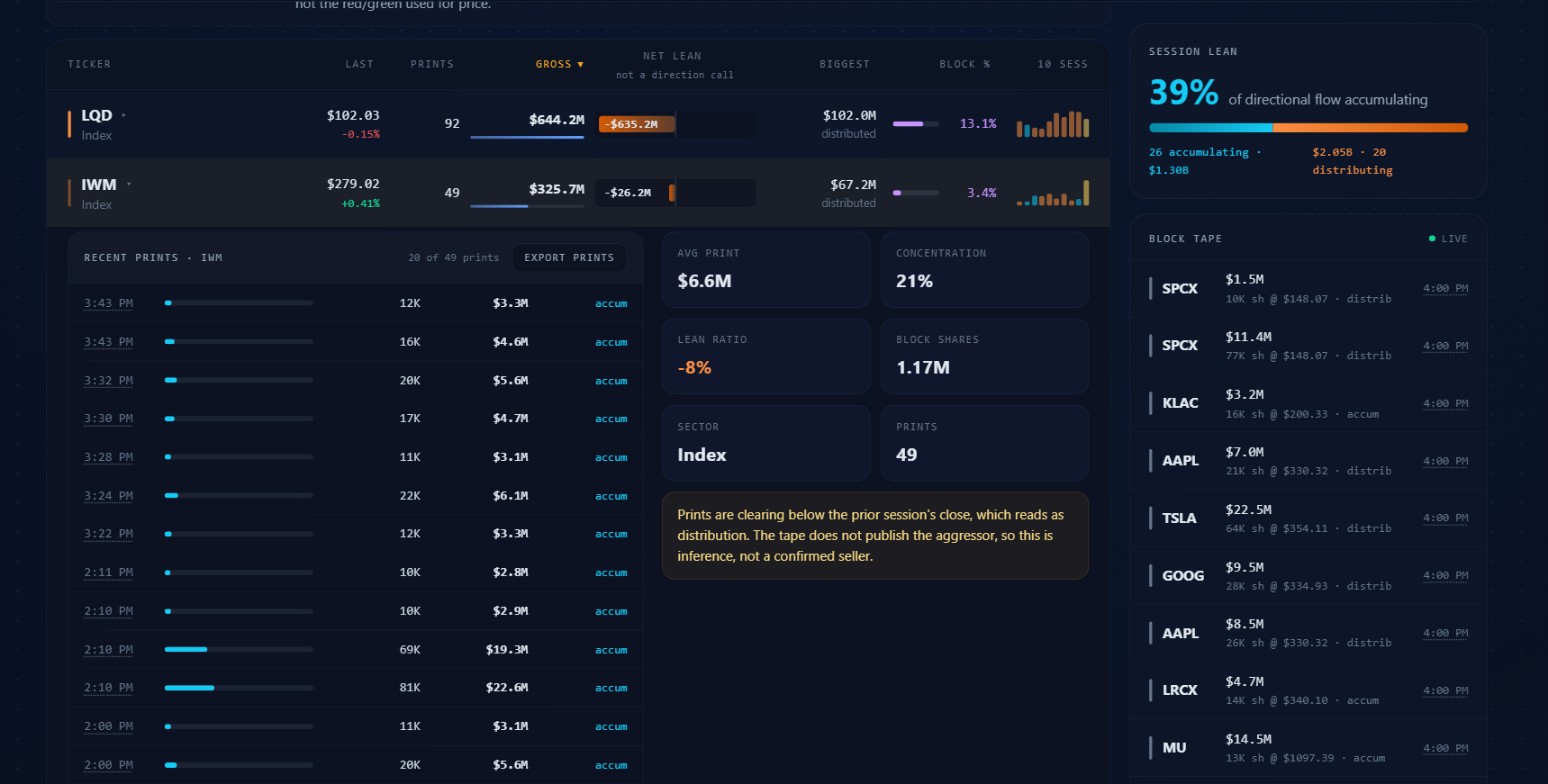 IWM expanded. Avg print $6.6M, concentration 21%, lean ratio -8%, block shares 1.17M, sector Index, 49 total prints. The caveat at bottom right explains the distribution inference.
Click any row and it expands to show the per-print tape and a set of summary stats. For IWM on October 1 you'd see:
- Avg print: $6.6M
- Concentration: 21%
- Lean ratio: -8%
- Block shares: 1.17M
- Sector: Index
- Prints: 49
The per-print list shows time, a notional bar, share count, notional, and lean tag (accum/distrib). Prices appear in the per-ticker CSV export, not in the expanded view itself. If you need the price level where a desk was working, export the tape and look at the clusters there.
At the bottom of the expanded drawer there's a yellow caveat box. On October 1 it said: "Prints are clearing below the prior session's close, which reads as distribution. The tape does not publish the aggressor, so this is inference, not a confirmed seller."
That caveat is there by design. We built it in because the lean classification system is genuinely limited and we'd rather you see the disclaimer every time you expand a distribution row than miss it once and make a bad trade.
How the lean calculation works
Worth being explicit about this since it affects everything.
For each print, the platform compares the execution price against the prior completed session's close. Specifically, it uses the close of the last finished trading day, not an in-progress VWAP or anything live. The reference is the official RTH closing price of the previous session.
- If the print executed more than 5 basis points above that reference: accumulation.
- If it executed more than 5 basis points below: distribution.
- Within that 5bp window on either side: neutral. Excluded from net notional entirely.
The net lean you see per ticker is accumulation notional minus distribution notional, with neutral excluded. A print that clears at the same price as the prior close doesn't vote.
Watch out: An institution doing a portfolio cross at market price can clear prints both above and below the prior close depending on where the stock is at that moment. The system classifies those prints differently without capturing any actual directional intent. Not every classified print reflects a real positioning decision.
This is sensible math. Over the course of a session with dozens or hundreds of prints, the aggregate tends to reflect whether size was generally willing to pay up (accumulation) or was willing to clear at a discount (distribution). But it's not the same as knowing who was buying or selling. Over a large enough sample it tends to track what positioning is actually happening, but a single session's lean can be noise.
The Blocks view
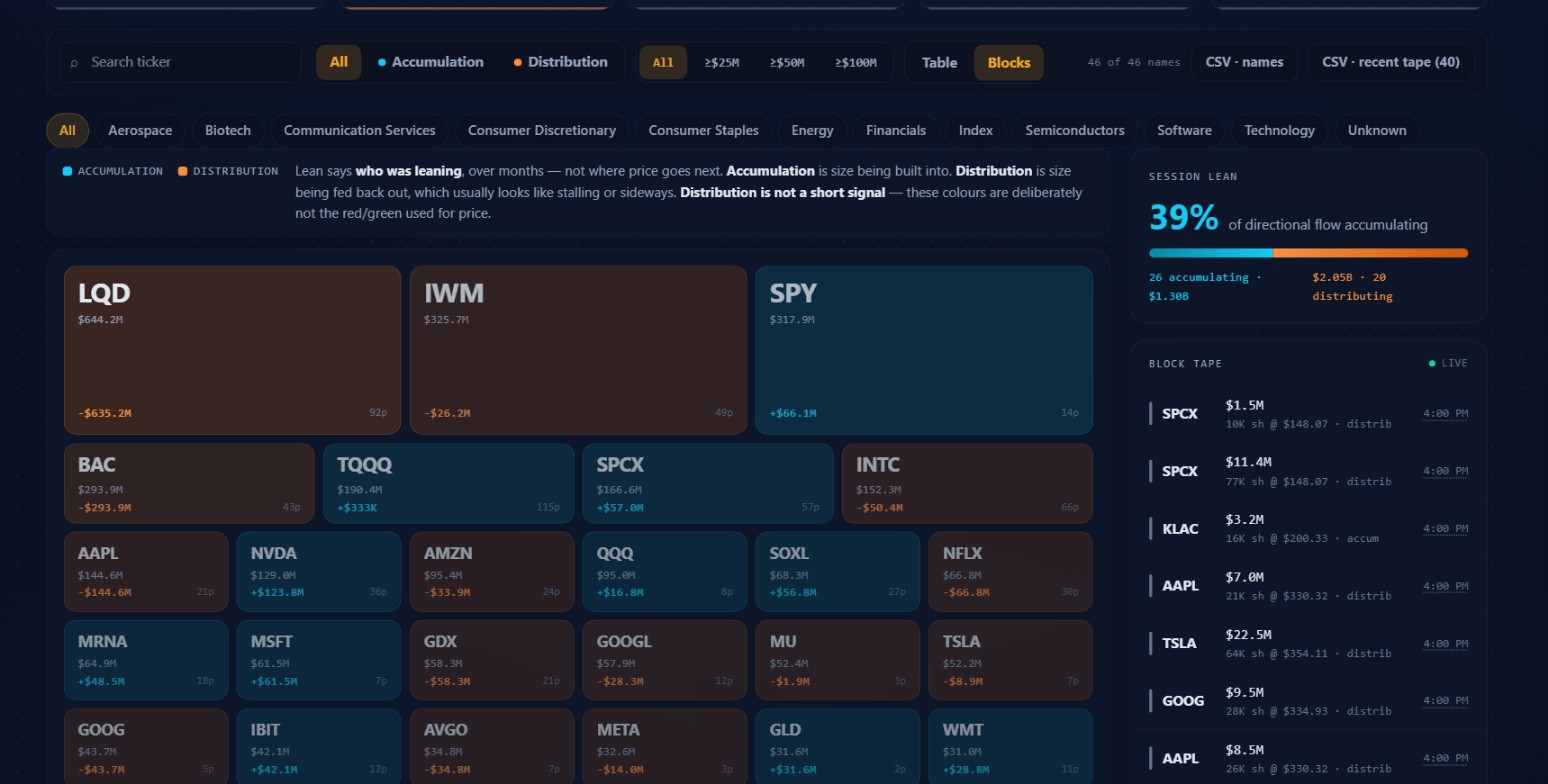 Switch to Blocks view to see the treemap. Tile size represents gross notional; color represents accumulation (cyan) or distribution (orange) lean. LQD, IWM, BAC dominate by size and are mostly distribution-orange.
Click "Blocks" in the filter bar and the table switches to a treemap. Each tile is one name. Tile size is proportional to gross notional. Color is the lean: cyan for accumulation, orange for distribution.
The October 1 treemap makes the session story immediately clear. Three enormous tiles at the top: LQD and IWM in orange (distribution), SPY in cyan (accumulation). Then a second row of medium tiles: BAC orange, TQQQ cyan, SPCX cyan, INTC orange. AAPL in orange. NVDA in cyan.
When you want to know at a glance "where did the big money go and which way did it lean," the treemap answers that faster than the table does. But for the specific numbers you come back to the table.
Try this: Open the Blocks treemap first for a quick session read, then click the tiles that stand out to jump to their table rows. The visual gets you to the right names faster than scanning the full table top to bottom.
You can click a tile in the treemap and it takes you to that ticker in the table view. That's useful when you spot something in the visual that you want to dig into at print level.
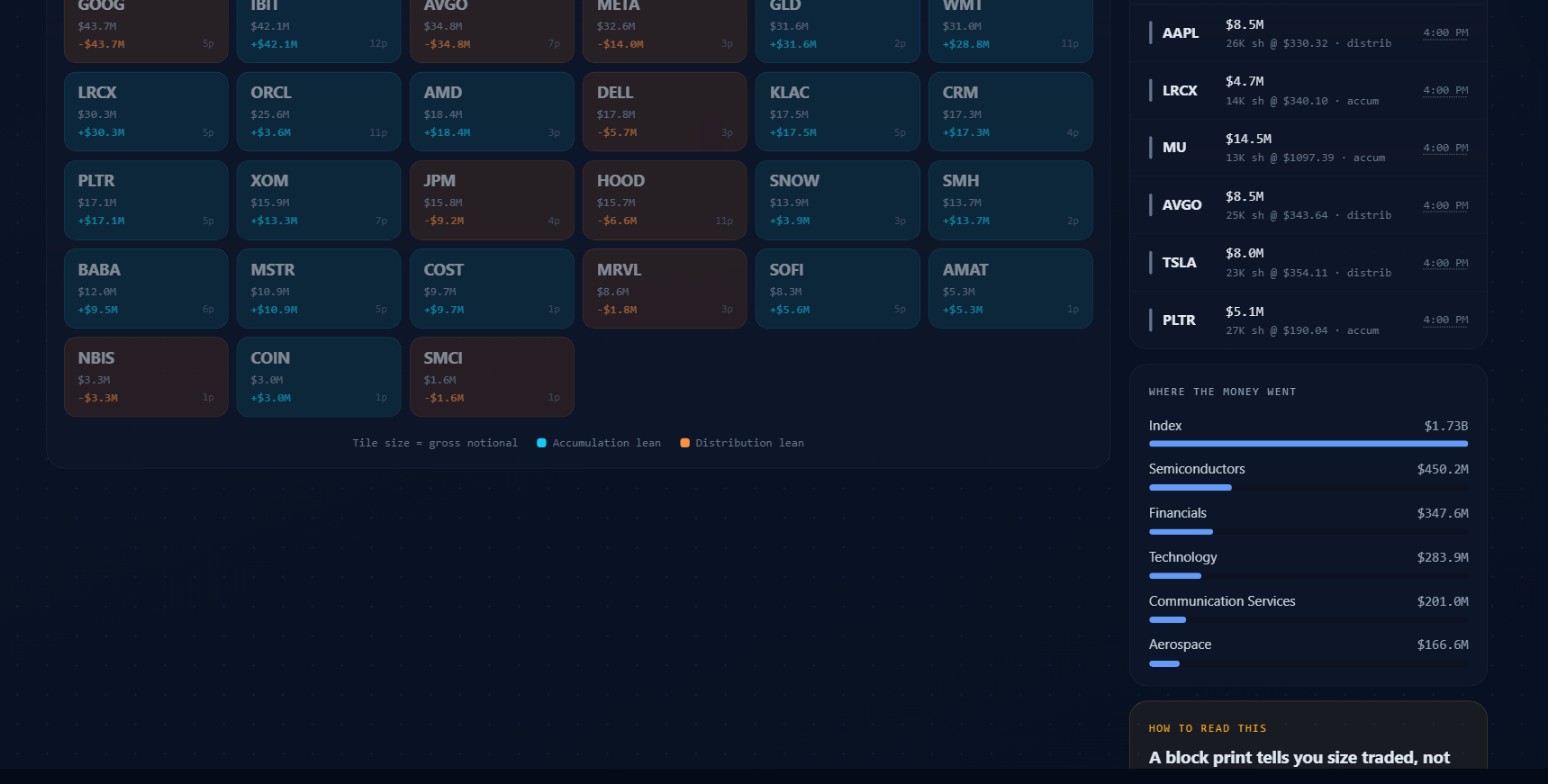 Lower treemap rows showing the smaller names, and the "Where the money went" sector panel on the right. Index names dominated at $1.73B.
The Session Lean panel
The right sidebar starts with Session Lean. On October 1: 39% of directional flow accumulating, shown as a gauge bar. Below that: "26 accumulating - $1.30B | $2.05B - 20 distributing."
That's 26 names with a net accumulation lean, representing $1.30B in net accumulation notional. And 20 names with a net distribution lean, representing $2.05B in net distribution notional. The dollar amounts there are net, not gross. So the overall session skewed toward distribution in dollar terms ($2.05B vs $1.30B), even though more names were technically accumulating (26 vs 20). When you see 39% accumulating, that's why it can coexist with more names on the accumulation side.
The Block Tape
Below the Session Lean gauge is the Block Tape rail, labeled "LIVE." This is a live feed of recent individual block prints across the universe, newest first. On October 1 after the close you could see: SPCX, SPCX, KLAC, AAPL, TSLA, GOOG, AAPL, LRCX, MU, AVGO, TSLA, PLTR. Each line shows ticker, notional, share count, price, lean tag, and time.
The tape is useful for catching prints as they happen during the session. A $22.5M print in TSLA at 64K shares. A $14.5M print in MU at 13K shares accumulation. You can watch the tape and see which names are actively getting worked during the day.
The tape shows up to 12 recent prints in the sidebar. The full tape is in the CSV export.
"Where the money went" sector bars
Below the Block Tape you get sector totals. October 1 showed:
Index $1.73B, Semiconductors $450.2M, Financials $347.6M, Technology $283.9M, Communication Services $201.0M, Aerospace $166.6M.
Index is the biggest sector almost every day because it includes SPY, QQQ, IWM, TQQQ, SOXL, and similar instruments. These are also the names most likely to be showing plumbing activity rather than directional intent. I tend to look past Index and focus on what's happening in Semiconductors, Financials, and Technology sector bars when I want to know if there's a theme running.
Clicking a sector bar filters the table to that sector. Click it again to deselect.
What the data is actually good for
Now that we've covered how the page works, let me tell you what I actually use it for.
Finding where size defended a level
When a name shows heavy block concentration around a price range over multiple sessions, that price is where real size was willing to transact. Export the tape, look at the price clusters. That level is a much better stop reference or invalidation point than a trendline you drew. It's backed by real transactions.
Getting a second opinion
Dark pool lean alone is not enough to trade on. Options flow alone is also not enough. Both sources pointing the same direction is a different conversation.
Key point: NVDA showing +$123.8M accumulation lean on the shares and simultaneous repeat call sweeps on Unusual Activity is two independent data sources agreeing. That combination has more weight than either one alone. Use the dark pool page for confirmation, not for idea generation.
NVDA showing +$123.8M accumulation lean on the shares and simultaneous repeat call sweeps on Unusual Activity is two independent data sources agreeing. That combination has more weight than either one by itself.
Spotting sustained positioning
The 10-session sparkline in the table is the column I come back to most. A single day of accumulation lean is noise. Ten sessions of consistent accumulation lean means somebody has been building for two weeks. That's meaningful, because institutional positioning at scale takes time and they can't hide the footprint completely.
Matching timeframe to data
Dark pool prints reflect positioning on a weeks-to-months horizon. A fund accumulating a position isn't expecting to flip it this afternoon. If you're going to act on this data, your trade horizon needs to match. Options expiring in three days don't line up with dark pool positioning. 60 DTE and longer is the minimum. Shares work too.
Green flags and red flags
Green: lean that has held for multiple sessions, not one spike. A ten-session sparkline that's been consistently one direction.
Green: Block % above 10 on the Today window for a mid-cap or smaller name. That means actual scale relative to what the stock does.
Green: dark pool lean and options flow on the same name pointing the same direction.
Green: concentration label with few prints and a large average, meaning one desk was working size.
Red: a fresh one-day lean you haven't seen building. Check back after a week before acting.
Red: SPY, QQQ, IWM, TQQQ at high gross but low block share. Index products move enormous volume off-exchange as a matter of daily plumbing. Unless block share is meaningfully high, the lean on these is background noise.
Red: a distribution lean you're thinking about shorting. This is the most common and most costly mistake on this page. Distribution means a desk is feeding stock out. While they're doing it, their working order is often what keeps a bid under the stock. Shorting into it means shorting into a name with a patient seller holding it up. It usually stalls, you pay theta, and it never drops as fast as you expected.
Red: quarterly rebalancing periods. Index rebalances produce enormous off-exchange crosses with zero directional opinion. The lean during those windows is meaningless.
Red: the row cap warning. When a session exceeds the row limit, the oldest prints get dropped and the lean is computed from what survived. The page tells you when this happens. A partial lean is still useful context, but discount it.
Watch out: Shorting DISTRIBUTION is the most reliable way to lose money on this page. A desk selling out of a position manages the supply carefully while doing it. The effect is sideways or slow drift, not a crash. You pay theta while it grinds and the drop you expected never comes fast.
Mistakes that cost people money
The most expensive mistake is shorting distribution. I'll say it again because it keeps happening. Distribution on this page means a desk is selling out of a position over time. They're working an order. While they're working it, they're providing liquidity from the sell side, which means the stock doesn't gap down because the supply is being managed carefully. The effect is sideways or slow drift, not crash. Shorting that and paying theta while it grinds sideways is a reliable way to lose money.
The second mistake is treating inference as a report. "The dark pool bought 4 million shares" is fiction. The platform captured 4 million shares of off-exchange volume that cleared mostly above the prior session's close, and classifies that as accumulation. That's meaningfully different from knowing who was buying or why.
The third mistake is mismatching timeframes. Weekly options on dark pool prints. Six-week data on a two-day expiry. The trades you're seeing represent months-long positioning. If you're right about the direction and the stock moves two months from now, your option is long expired.
How it pairs with other tools
The intended workflow is to find ideas elsewhere and bring them here for confirmation, not to generate ideas here.
Start at Unusual Activity. Options flow has a direction, a timeframe, and a premium commitment attached. When something shows repeat bullish sweeps over multiple sessions, that's an idea. Then come here and ask: is anybody accumulating the actual shares too?
If yes, you have two independent inputs. One from the options market (someone paid for the right to profit if the stock goes up) and one from the equity market (someone built a long position in the shares). That's the combination worth paying attention to.
For deeper research on a specific ticker, Ticker Search shows options flow history on individual names. Cross-reference what you see in the dark pool lean with what's happened to that ticker's options prints over the same period.
GEX tells you about the options dealer positioning that affects how the stock moves. A name with heavy accumulation in the dark pool, bullish options flow, and positive GEX dealer positioning is three inputs pointing the same direction. I'm not saying that's a guarantee of anything, because nothing about this data predicts price with certainty. But it's a much more defensible setup than one input alone.
For sector-level context, Sector Flow shows where institutional options flow is going by sector. If Semiconductors is showing institutional accumulation in options and the dark pool sector bar is also showing Semiconductors as the second-largest sector with a mostly-accumulation lean, that's a theme.
Live Flow rolls up the $20K-plus options tape per ticker: total premium, trade count, a bull/bear split bar, and the biggest recent print for each name. When a name is showing up there with heavy bullish premium at the same time its dark pool lean is accumulation, that's the kind of cross-market agreement worth digging into.
A simple routine
If you want to use this page without overthinking it, here's what I'd do.
After the close, open the dark pool page on the Today window. Sort by gross notional. Scan the Biggest Block column for concentrated prints. Check the 10-session sparklines for anything showing consistent lean over two weeks.
If something looks interesting, expand the row and look at the print distribution. Many small prints vs a few massive ones tells you something different about what was happening. Export the ticker tape if you want the actual price levels.
Then open Unusual Activity and search for that same name. If the options flow has been bullish while the shares show accumulation, write down the price range from the tape export. That range is your stop reference if you decide to trade.
Check back Friday. Has the lean held? Getting stronger or reversing? One week means very little. Four weeks means something.
For the Heat Map on any sector you find interesting in the sector bars, you can see at a glance how names within that sector have performed relative to each other. Combine that with the dark pool sector bars and you start to see which sectors are actually getting institutional share-level attention.
What the Dark Pool page is not
Dark Pool is one of six tools under Options Flow alongside Unusual Activity, Live Flow, Heat Map, Sector Flow, and Earnings Flow. It's the only one covering equity prints rather than options prints. That distinction is the whole point: a different market, a different instrument, potentially the same direction. When the options market and the equity market independently point the same way, that agreement has weight. Neither one alone is enough.
This page won't tell you about names outside the 50-ticker universe. It won't distinguish a hedge from a directional buy. It won't tell you who was on each side of a cross. What it will tell you is where size was willing to transact, and roughly which way that size was leaning relative to where the stock closed the day before. That's genuinely useful context. It's just a narrower claim than what most social media accounts make when they post dark pool screenshots.
Options trading involves substantial risk and is not suitable for all investors. The analysis and data on this page are for informational purposes only and do not constitute investment advice. Nothing here should be interpreted as a recommendation to buy, sell, or hold any security.