
Options Flow deep dive · 20 min read
How to Read Unusual Options Activity
A full walkthrough of the Unusual Activity page: every column, preset, and scoring mechanic, with real examples from the October 1, 2026 session.
Open the tool →Hey guys, Art from TraderMatrix here. October 1st, 2026, 9:45 in the morning: SPY prints a $141.1M call golden sweep. That's the first entry in the "Largest Trade" slot for the day, and it happened before most people finished their coffee. No explanation attached, no press release, just a massive options bet on the tape.
This page is where you find those. Not every print is that large, and most sessions won't be that clean. But the Unusual Options Activity feed is where I start every single morning, because it's the closest thing to a real-time map of where institutional capital is moving in the options market.
This walkthrough covers everything: the stats bar, the preset cards, every filter, every column in the feed, the scoring system, and the two panels at the bottom that most people scroll past. I'll use actual rows from the October 1st session throughout.
The short version:
- The score compares each print to that ticker's own 30-day baseline, not a universal scale.
- The four preset cards encode specific use cases; New Money is where most sessions start.
- Always read the Sentiment sub-line: "Calls Closing" means money is leaving, not entering.
- THIN OI tags mean a ratio looks high because the base is tiny; spread risk is real.
- Whale Watch and Smart Money Dossier add a second data source below the main feed.
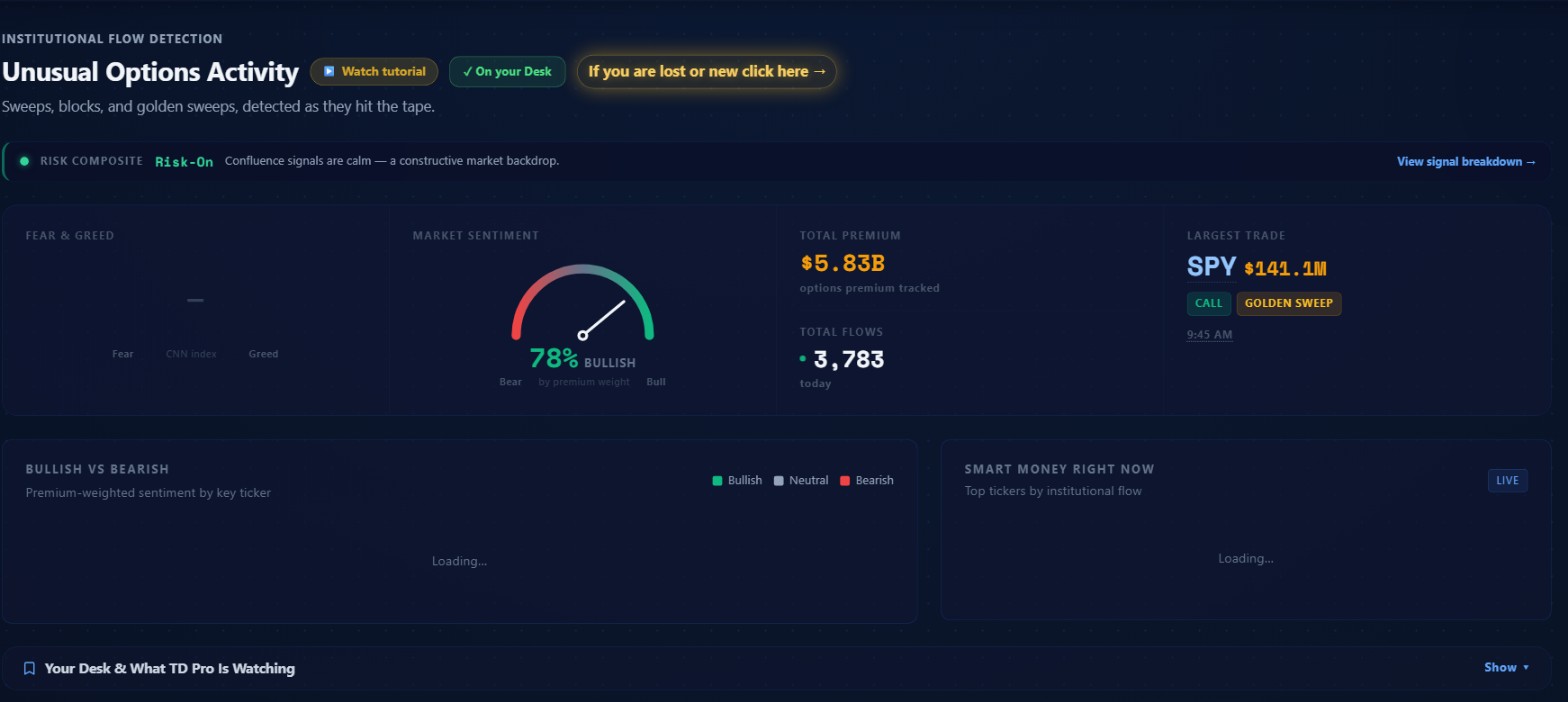 October 1, 2026: Risk Composite reads "Risk-On," the stats bar shows $5.83B in total premium tracked with 3,783 flows detected, market sentiment sits at 78% bullish, and the day's largest single trade is the SPY $141.1M call golden sweep at 9:45 AM.
The stats bar: market context before individual names
Before you look at any specific row, the top of the page gives you a read on the whole session.
The Risk Composite banner runs across the top. October 1st read Risk-On, with the description "Confluence signals are calm, a constructive market backdrop." This isn't a price target or a direction call; it's a description of whether the options market is behaving in a risk-seeking or risk-off way overall. Click "View signal breakdown" if you want to see what went into it. If this shows Risk-Off and you're about to trade bullish flow you spotted in the feed, that friction is worth pausing on.
The Market Sentiment dial is the large gauge in the stats bar. 78% bullish on October 1st, measured by premium weight. That means 78 cents of every tracked dollar committed that session went toward calls or bullish positioning, counting only prints where the bid/ask makes the side clear. The dial counts dollars, not trades. One $100M sweep can move it more than fifty smaller prints combined.
Key point: Market Sentiment is dollar-weighted, not trade-weighted. One large sweep can shift the reading more than dozens of smaller prints pointing the other direction.
Total Premium was $5.83B on October 1st. On a quieter day you'll see significantly less. This number matters most as context: a session where total premium is unusually elevated means more participation and generally more signal in the feed.
Total Flows: 3,783 tracked events. With the 60+ score filter active in the screenshot, the feed shows 488 of those. The gap between 3,783 and 488 is the scoring system doing its job.
Largest Trade in the top right gets a permanent slot: SPY $141.1M, call, golden sweep, 9:45 AM. One print, nine figures.
Below the stats: the Bullish vs Bearish chart breaks down premium-weighted sentiment by individual ticker, showing where the directional conviction concentrated that session. The Smart Money Right Now panel next to it surfaces the names with the highest institutional flow concentration in real time.
The preset cards: filter stacks in one click
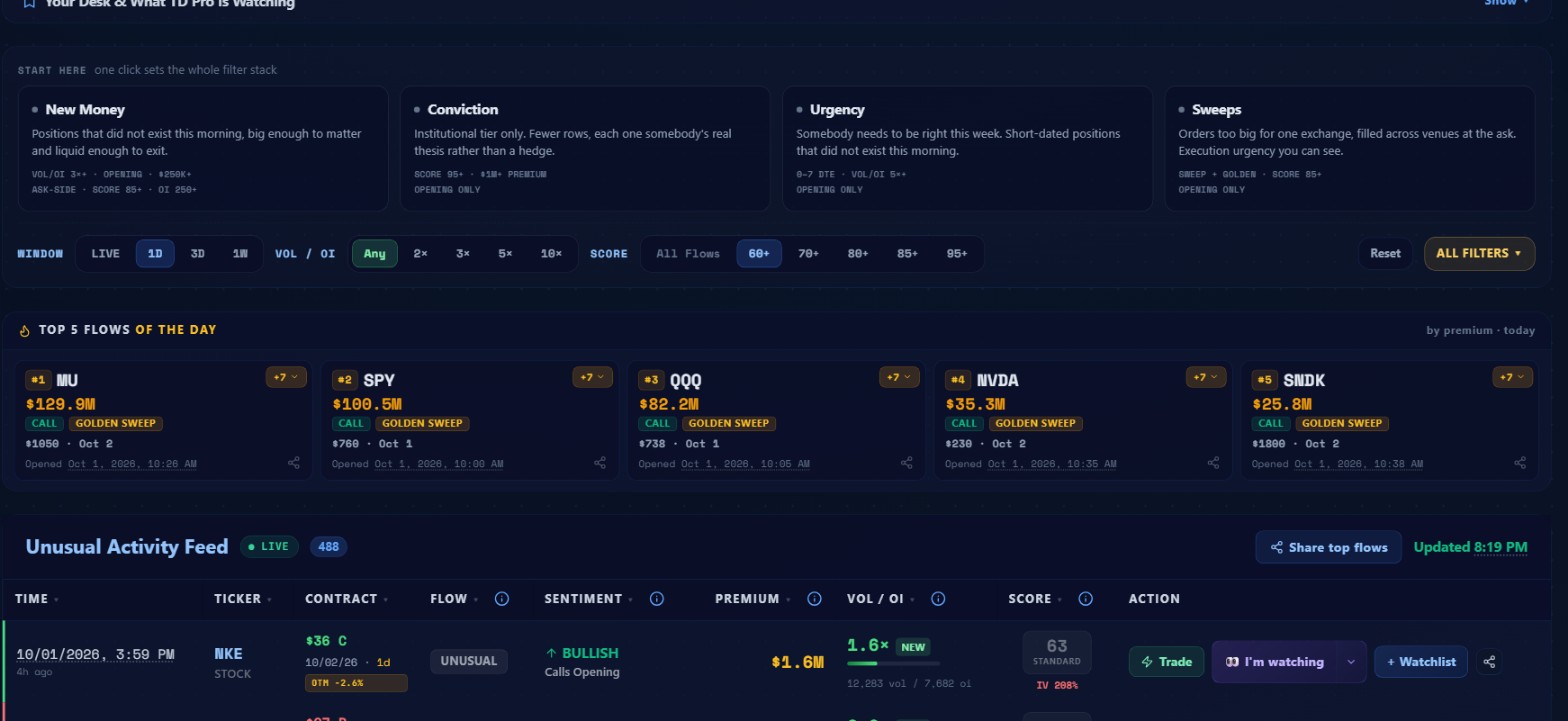 Four "Start Here" preset cards sit above the filter row. The 60+ score filter is active, returning 488 results. The NKE row is visible at the bottom of the image.
Most people skip straight to the feed. The four preset cards are worth understanding because they encode specific use cases, and clicking one saves you several minutes of manual filter work.
New Money applies: Vol/OI 3x or higher, opening trades only, $250K or more in premium, ask-side execution, score 85+, and an OI floor of 250. That last filter matters more than people realize. It eliminates cases where the Vol/OI ratio looks extreme purely because the base is tiny and the contract is essentially illiquid. This is where I start on most mornings.
Try this: Open each morning with the New Money preset before touching any other filter. It stacks the most meaningful restrictions in a single click.
Conviction narrows to score 95+, $1M or more in premium, opening only. Fewer rows, each one flagged by the scoring system as extreme relative to that ticker's own history, and clearing a meaningful absolute premium bar. These tend to be the rows you spend more time on.
Urgency filters to 0-7 DTE, Vol/OI 5x or higher, opening only. Short-dated, aggressive, new positioning. This could be retail chasing a move, or it could be someone who missed earlier positioning and is loading up fast. You can't tell from one row; pair this with Ticker Search to check whether similar flow has been building through the week.
Sweeps keeps only sweep and golden sweep execution types, score 85+, opening only. This is specifically about how the order was executed. Sweeps are orders large enough that they had to cross multiple venues or fill against multiple market-maker quotes in rapid succession. The urgency is visible in the mechanics of the execution itself.
The filter row below the presets lets you build your own combination. Window changes the lookback period: Live, 1D, 3D, or 1W. Vol/OI steps at 2x, 3x, 5x, and 10x. Score runs from All Flows through 60+, 70+, 80+ (the default), 85+, and 95+. The ALL FILTERS button opens the full advanced panel, and Reset clears everything back to defaults.
Top 5 flows of the day
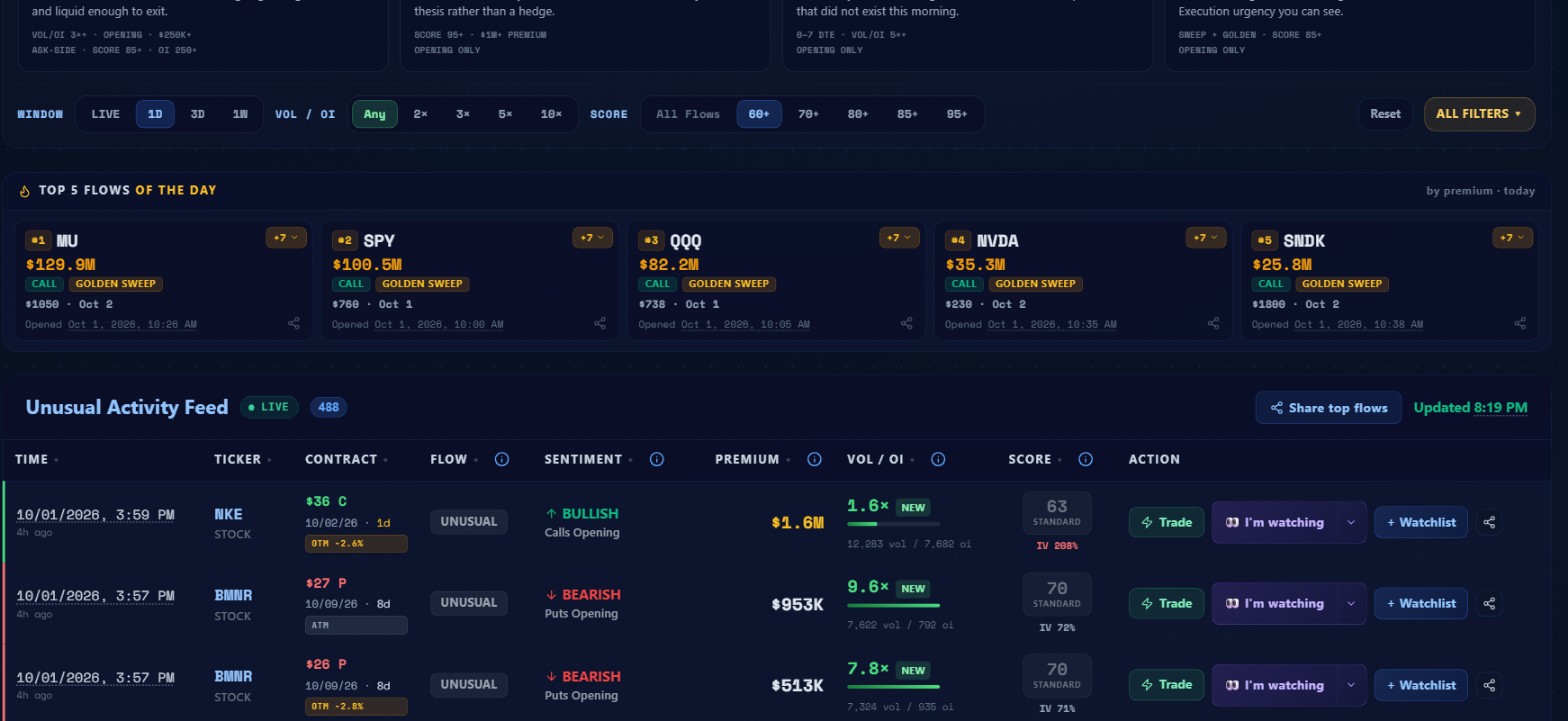 October 1st's top five by total premium: MU $129.9M call golden sweep at $1050 (Oct 2 expiry, opened 10:26 AM), SPY $100.5M, QQQ $82.2M, NVDA $35.3M, SNDK $25.8M. All five were calls. All five were golden sweeps.
Directly above the main feed, the Top 5 Flows section surfaces the five largest premium prints of the session. October 1st: MU led at $129.9M, followed by SPY at $100.5M, QQQ at $82.2M, NVDA at $35.3M, and SNDK at $25.8M.
I'll leave the interpretation there. Five prints, all calls, all golden sweeps, on a single session.
Each card shows ticker, premium, contract details, and when it opened. The share icon lets you pull the card directly, useful when documenting a setup or posting research.
The main feed: all nine columns
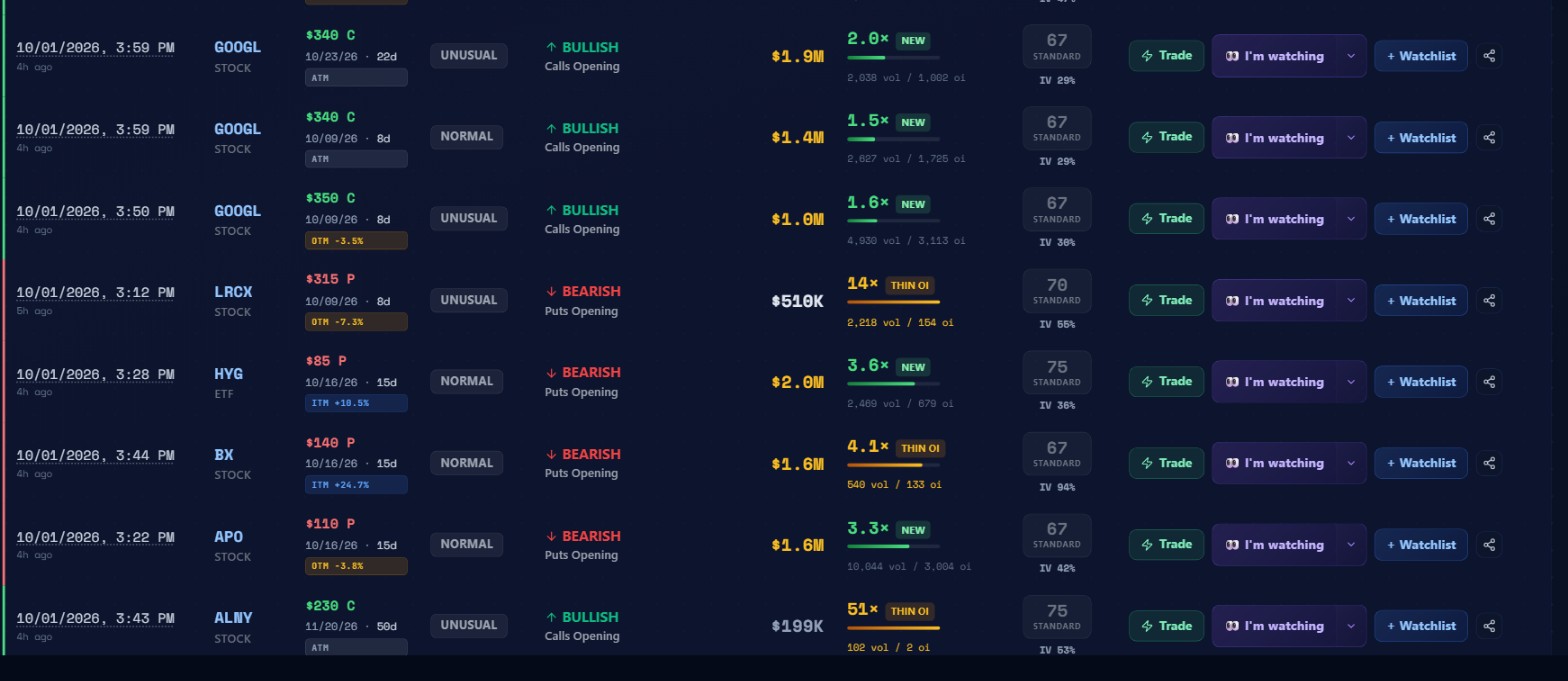 A section of October 1st's Unusual Activity Feed. Three GOOGL call rows appear near the close: $340 C expiring 10/23 (22d) and 10/09 (8d), and $350 C expiring 10/09 (8d), all BULLISH Calls Opening. LRCX shows a $315 P with a 14x THIN OI tag on only 154 oi. HYG, BX, and APO show bearish put flow; ALNY carries a 51x THIN OI tag on just 2 oi.
The feed has nine columns. Here's what each one actually tells you:
 Two rows in detail. AMD: $635 call, 10/09/26 expiry (8d), OTM -3.1%, SWEEP execution, BULLISH with "Calls Opening," $1.8M premium, 1.9x NEW (1,735 vol / 919 oi), Score 72 STANDARD, IV 47%. GOOGL: $340 call, 10/23/26 (22d), ATM, UNUSUAL, BULLISH with "Calls Opening," $1.9M, 2.0x NEW (2,038 vol / 1,002 oi), Score 67 STANDARD, IV 29%.
Time. When the print hit the tape. The AMD row in the screenshots shows 3:58 PM, with the relative sub-line reading "4h ago" at after-market capture. During regular hours this reads in minutes.
Ticker. Underlying symbol and type: STOCK, ETF, or INDEX. AMD and LRCX are both STOCK.
Contract. Strike, type (C for call or P for put), expiry date, and DTE. The AMD row shows $635 C, 10/09/26, 8d. Eight days to expiry. LRCX shows $315 P, 10/09/26, 8d. Below the expiry, a color-coded OTM/ITM/ATM badge shows how far the strike sits from the current stock price. AMD showed OTM -3.1%; LRCX showed OTM -7.3%.
Flow. The execution classification: UNUSUAL, NORMAL, SWEEP, BLOCK, or GOLDEN SWEEP. UNUSUAL means the print cleared the platform's quality filters without fitting a specific pattern. SWEEP means the order was filled aggressively across multiple venues or counterparties, showing urgency in the execution. BLOCK is a single large negotiated print, typically arranged off-exchange between two parties. GOLDEN SWEEP is the highest classification: $2.5M or more in premium, a Vol/OI ratio of 5x or higher, AND within 15% of the current stock price. That combination is rare, and it can apply to any trade type (a block can be upgraded to a golden sweep if it clears all three criteria simultaneously). On October 1st, LRCX was UNUSUAL and AMD was SWEEP.
Sentiment. Two pieces of information stacked: the direction label (BULLISH or BEARISH) and the sub-line showing whether the position is being opened or closed. "Calls Opening" means calls bought at the ask, new position. "Puts Opening" means puts bought at the ask, new position. If you see "Calls Closing," somebody is selling to close a profitable position: the direction label might say BULLISH but the money is leaving, not entering. Always read the sub-line.
Premium. The dollar amount committed: price times contract count times 100. AMD's $1.8M means whoever bought those $635 eight-day calls committed $1.8 million. This is the primary anchor for deciding whether a row deserves attention. The LRCX put came in at $510K on an 8-day position in the same session.
Vol/OI. Three pieces of data in one column: the ratio itself, a tag (NEW, OLD, or THIN OI), and the raw numbers as a sub-line. NEW means today's volume exceeded the existing open interest: the position mostly didn't exist before this session. OLD means volume is below existing OI, which could be someone closing or rolling. THIN OI is a warning: the ratio looks high but the base is tiny. On October 1st, LRCX showed 14x with a THIN OI tag and only 154 contracts of underlying open interest. High ratio, small market, and the spread will reflect that.
Score. The composite conviction number. More on the mechanics below. The score also shows a tier label (STANDARD, with higher tiers above) and the contract's implied volatility as a sub-line. AMD showed Score 72 STANDARD with IV 47%. Short-dated contracts often carry elevated IV; the NKE $36 call at the top of the feed (1d DTE) carried IV 208%, a direct result of its one-day expiry.
Action. Four options: Trade (linked to your connected broker), "I'm watching" (internal tracker), + Watchlist (adds the ticker), and a share icon.
How the score is built
The score has four base components and up to three bonuses.
Base components, max 100 points:
| Component | Max points | What drives it |
|---|---|---|
| Vol/OI ratio | 40 | Percentile vs the ticker's own 30-day baseline |
| Premium size | 30 | Absolute and percentile: $1M or more = full marks, $500K+ = 20pt minimum |
| Bid-ask spread | 15 | Tighter spread signals institutional execution quality |
| DTE conviction | 15 | 30-90d thesis trades or 0DTE urgency both score full marks |
Bonuses (additive on top of the base):
- SWEEP or GOLDEN SWEEP: +15 for aggressive multi-venue execution
- BLOCK: +10 for institutional negotiated size
- Contra-market: +10 when calls are bought on a down day or puts on an up day, and the underlying moved more than 1% against you
The ceiling is 125. The highest score observed in the trailing 30-day window before this guide was written was 115. Scores of 110 or above occur roughly once a day across the full feed.
A few things about this system that matter in practice:
The Vol/OI component is percentile-based against the ticker's own history, not a universal scale. NVDA sees enormous daily options volume; a 3x ratio on NVDA scores differently than a 3x ratio on a smaller name where 3x might sit at the 99th percentile of that ticker's historical observations. The score accounts for this. That's why the raw ratio alone isn't enough: the score is doing the comparison against that ticker's own baseline, not the market in general.
Watch out: The raw Vol/OI ratio alone does not tell you how unusual a print is. A 3x ratio on NVDA scores differently than 3x on a smaller name where that ratio sits at the 99th percentile of its history. Always check the score, not just the ratio.
The contra-market bonus surfaces contrarian bets. When someone is loading calls while the stock is selling off, or buying puts into a rally, they're paying up to fight the tape. That takes conviction. A print that earns the contra-market bonus on top of an already-high base score is worth an extra look.
The premium component also has a percentile layer alongside the absolute thresholds. But once a print hits $1M or more, the algorithm gives it full marks regardless of relative context. A million dollars is just a significant absolute bet.
Reading a real row
Take LRCX from October 1st, the row with the THIN OI tag in the screenshot above. $315 put, 10/09/26 (8 days out), OTM -7.3%, UNUSUAL flow, BEARISH with "Puts Opening," $510K in premium, 14x THIN OI with 2,218 vol vs 154 OI, score 70 STANDARD, IV 55%.
What the row tells you: someone opened a put position and the day's volume dwarfed the 154 contracts that existed at that strike beforehand. The ratio reads 14x because the base was tiny. The 8-day expiry says they need to be right within two weeks, and a strike more than 7% out of the money says they are expecting a real move, not a wiggle.
What it doesn't tell you: whether this is a standalone directional bet or one leg of a spread. Whether there are offsetting calls at the same expiry. What the thesis behind it is. Whether LRCX reports earnings in the next 8 days. That last one is the most important check on any short-dated put. If an earnings date falls inside the expiry window, you're looking at a binary event, not a directional trade.
Watch out: On any short-dated print, check the earnings calendar before anything else. An earnings date inside the expiry window changes what you are looking at entirely.
The THIN OI tag is the other thing to respect. A 14x ratio on 154 contracts of open interest is a different animal from a 14x ratio on 15,000. The market for that strike is thin, so getting in and out costs more.
A score of 70 also sits below the 80+ filter option. With that setting active, this row disappears from the feed. The 60+ filter shown in the screenshot keeps it. The gap between 3,783 total flows and the 488 visible rows is the scoring system doing its job.
Now compare LRCX to the AMD row from the same session: $635 call, also 10/09/26, SWEEP execution, BULLISH Calls Opening, $1.8M premium, 1.9x NEW, score 72. More than three times the premium, a more aggressive execution pattern, and a much healthier base: 1,735 volume against 919 open interest. But a lower ratio, 1.9x versus 14x. AMD is bigger money added on top of an established position. LRCX is smaller money on a base so thin that the ratio runs hot. They're different characters, and one isn't inherently more interesting than the other.
Three GOOGL rows also appeared near the close that session: a $340 C for 10/23/26, a $340 C for 10/09/26 and a $350 C for 10/09/26, all BULLISH Calls Opening, between $1.0M and $1.9M in premium each. Same name, similar expiries, neighboring strikes, rapid succession. Worth a second look.
Whale Watch and Smart Money Dossier
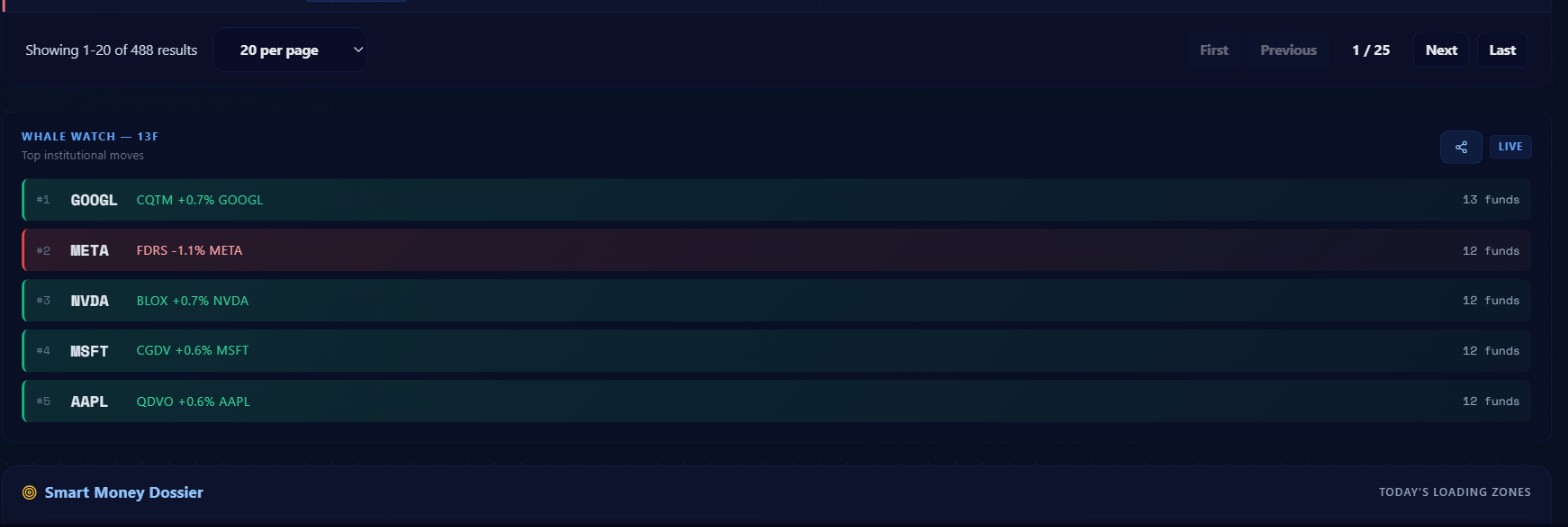 Below the 488-result feed: Whale Watch 13F shows the top five names by net ETF fund count. October 1st: GOOGL led with 13 funds (lead fund CQTM, +0.7% weight), META 12 funds, NVDA 12, MSFT 12, AAPL 12.
Below the main feed, past the pagination, are two panels that pull a different type of information.
Whale Watch 13F shows the five tickers with the highest net ETF fund count moving in one direction from the latest holdings snapshot. Each row gives you a ticker, a lead fund (the ETF with the largest absolute portfolio weight change for that name), a signed weight delta, and the total net fund count.
On October 1st: GOOGL sat at the top with 13 funds and a lead fund of CQTM at +0.7%. That "+0.7%" means CQTM increased its GOOGL allocation by 0.7 percentage points in its most recent holdings snapshot. The net fund count is BUYING funds minus SELLING funds, so 13 here means 13 more ETFs were adding to GOOGL than reducing it in the same snapshot window. META followed at 12 funds, then NVDA (12), MSFT (12), and AAPL (12).
The data behind this panel comes from daily ETF holdings snapshots. It reflects the most recent recorded portfolio weight changes across tracked ETFs and funds. The lead funds are ETF tickers (CQTM, FDRS, BLOX, and similar), not traditional hedge fund names.
When a name appears here and shows strong unusual options flow on the same session, that convergence is worth paying attention to. October 1st: NVDA had its $35.3M golden sweep in the Top 5 and sat at 12 funds in the Whale Watch. GOOGL had three call rows in the feed near the close and led the Whale Watch at 13 funds.
Key point: When a name shows strong flow in the feed and also leads the Whale Watch on the same session, that is two separate data sources pointing at the same name. It is worth more attention than either signal alone.
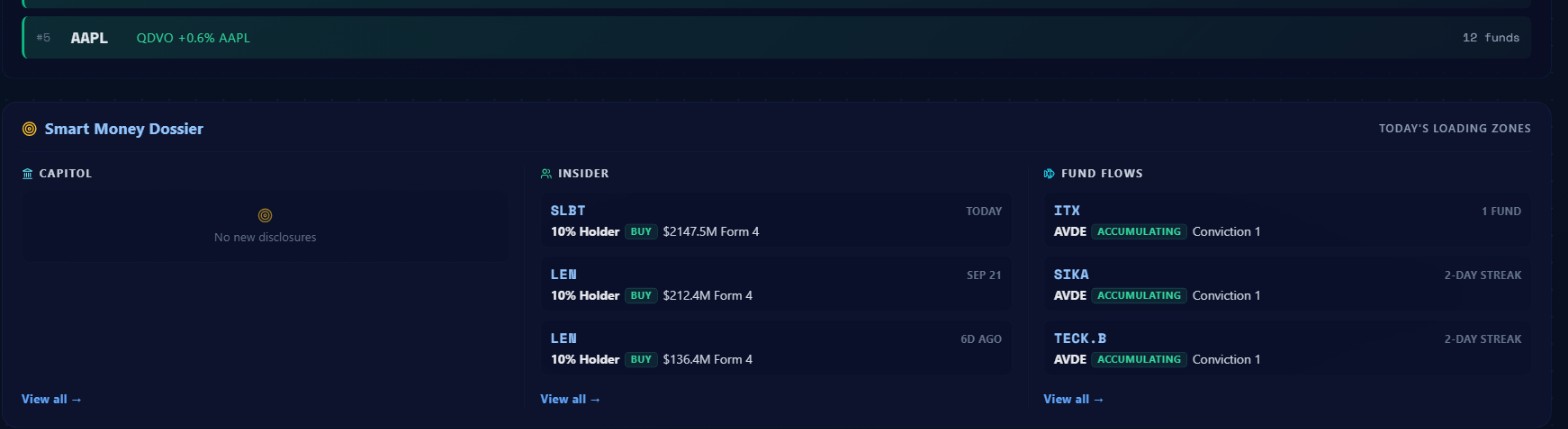 Smart Money Dossier: Capitol shows no new congressional disclosures on October 1st. Insider shows SLBT with a $2,147.5M Form 4 buy filed that day, and LEN with two Form 4 buys: $212.4M filed September 21 and $136.4M filed 6 days prior. Fund Flows shows ITX (1 fund, Conviction 1), SIKA (2-day streak), TECK.B (2-day streak).
Smart Money Dossier has three panels:
Capitol tracks congressional trading disclosures. October 1st had no new filings. When there are recent ones, they show the date and transaction size. These are stock transactions, not options, but convergence between congressional activity on a name and unusual options flow in the same week is worth noting.
Insider shows Form 4 filings from executives and directors. October 1st: SLBT had a 10% holder buying $2,147.5M in a Form 4 filed that same day. LEN had two separate Form 4 buys: $212.4M on September 21 and $136.4M filed 6 days prior. A 10% holder committing $2.1 billion in a single Form 4 is a real statement. That's not hedging, that's a large bet from someone who knows the business better than any analyst covering it.
Fund Flows surfaces tickers where accumulation data suggests active building. October 1st: ITX (1 fund, Conviction 1 rating), SIKA (2-day streak), TECK.B (2-day streak).
These three panels let you check whether unusual options flow has any structural backing from the slower-moving parts of the same capital ecosystem. Most of the time there's no overlap. When there is, it's worth paying attention.
This page vs the other five flow tools
This is the question I get most often. Which feed should you be using?
| Tool | What it surfaces | Best for |
|---|---|---|
| Unusual Activity | Individual prints scored against each ticker's history | Starting point every session |
| Live Flow | Per-ticker premium roll-up: trade count, bull/bear split, largest print | Seeing which names are accumulating the most aggregate flow |
| Heat Map | Visual overview of the whole tape by sector and name | A 30-second orientation before drilling into rows |
| Sector Flow | Premium aggregated by sector | Checking whether a name's flow is part of a rotation or isolated |
| Earnings Flow | Pre-earnings positioning | Any short-dated print on a name with an upcoming earnings date |
| Dark Pool | Large equity blocks executed off-exchange | A second data source on the same name from a different instrument |
The sequence I use in practice: Unusual Activity to find the name, Sector Flow to check whether the broader sector is moving, Ticker Search to see if this is a new print or a pattern that has been building. Dark Pool as a fourth check if the thesis is strong enough to warrant it.
A daily routine that actually works
Before 9:30, I open the page and check the Risk Composite banner and the sentiment dial. Backdrop first, before individual names.
I click New Money. That preset is the closest thing to "where is real conviction being built today" in one click. I sort the results by score, descending.
I take the top two or three rows above 80. Not ten. Two or three. On each one I open Ticker Search and check: has this flow been building for several days, or is this the first appearance? Multiple prints on the same strike across several sessions is accumulation. A single large print is information. It's not the same as a pattern.
Try this: On any print you want to follow up on, open Ticker Search and check whether similar flow appeared in prior sessions. Repeated prints at the same strike across multiple sessions are accumulation. A single spike is not.
I check Sector Flow for each name. Is the whole sector moving, or just this ticker?
If anything is short-dated, under two weeks out, I check the earnings calendar before anything else. An earnings date inside the expiry window changes the entire nature of what I'm looking at.
End of session, five minutes: did anything score 95 or above today? Did the Top 5 include names I've been tracking? Did Whale Watch surface any tickers that also had strong feed activity? That overlap is the setup I'd most want to be in the next day.
The one thing I'd actually change about how most people use this page: they look at it all day. More prints don't mean more signal. I look twice: pre-market to identify, end of day to review. Anything in between is mostly noise exposure.
Common mistakes
Copying the exact contract. A fund holding 6,000 contracts can absorb a 40% drawdown on that leg without it materially affecting their book. You probably can't. Their one-day $36 NKE call has portfolio context you don't have access to. If the thesis interests you, take a longer expiry and a strike closer to the money. You're borrowing the direction, not the ticket.
Reading large puts as automatically bearish. Institutions buy puts constantly to hedge equity positions they've held for years. A $4M put on an index ETF is almost certainly insurance. The tells: long-dated, far out of the money, Vol/OI below 1.0x. And check the sub-line in the Sentiment column: "Puts Closing" means the money is coming out, not going in.
Using the score as a single number without looking at what built it. A score of 90 driven primarily by the BLOCK bonus (negotiated, low Vol/OI) is different from a score of 90 driven by extreme Vol/OI percentile on an aggressive SWEEP. Same number, different character. Click into the row and understand what's contributing before you do anything with it.
Ignoring THIN OI tags. When you see that tag, the ratio is high because the denominator is tiny. The LRCX row on October 1st showed 14x with only 154 contracts of existing open interest. Getting into that trade is straightforward. Getting out without giving away half your move is not.
No exit plan at entry. Flow tells you where to look. It doesn't tell you when to leave. Institutions don't file paperwork when they close an options position. Their exit is invisible to the feed. Write down your target, your stop, and the date before you enter anything, and treat those as binding, not suggestions.
What the feed doesn't tell you
Options flow shows you where institutional money went. It doesn't tell you the reason, the time horizon of the buyer relative to their overall book, whether this is one leg of a multi-leg structure, or whether the buyer turns out to be right. Institutions are wrong with large amounts of money more often than most people realize. The score tells you the trade was deliberate and significant. It says nothing about outcome.
The feed also has no memory of your thesis. Nothing flags when the institutional buyer reverses course or adds to the position. You have to check that yourself.
One question I've never been able to fully answer: on sessions like October 1st where the Top 5 are all calls and all golden sweeps across different underlying names and different sectors, how much of that is genuine independent conviction versus systematic strategies that happen to all look similar in a given macro environment? The data shows you the prints. It doesn't untangle the reason behind the correlation.
Options carry the full risk of loss on the premium paid. Short-dated contracts can go to zero in a single session. Nothing in this article is financial advice. The October 1st rows are presented to explain how to read the tool, not as recommendations.
If I had to name one thing that separates traders who use this feed effectively from those who don't: the ones who do well treat it as a shortlist, not a signal. They use it to narrow thousands of tickers down to two or three names worth researching. The actual research is still theirs to do.