Loading...

Options Flow deep dive · 18 min read
How to Read the Flow Heat Map
Every card on the Flow Heat Map is sized by total premium and colored by net direction. This guide covers how urgency is computed, what the color, size, and badge actually mean, and how to use the board as a first-pass filter before going deeper on any name.
Open the tool →Hey guys, Art from TraderMatrix here. The Flow Heat Map is one of those pages where people think they understand it the moment they see it. Colored cards. Bigger means more. Green means good. That mental model gets you through the first week. Then you spend a month wondering why your reads are inconsistent, and eventually you figure out that size, color, and the badge on each card are measuring three completely separate things, and you were conflating all three.
Let me walk through what's actually on the page and how to use it.
The short version:
- Card size = total premium relative to the board. Color = net direction. Glow = urgency (aggressive execution). These are three separate signals.
- The UNUSUAL badge fires based on execution pattern, not on direction. Badge and color must agree for a clean read.
- Two flows is the minimum to appear. Check the footer flow count before acting on a small card.
- Neutral gray cards can carry hundreds of millions in premium; they mean flow balanced out, not that nothing happened.
- Check a card at open, at noon, and in the final hour. Persistence through the session matters.
What urgency means in options flow
This page is built on a specific concept of urgency, so let's get that straight before anything else.
When someone places an options order they have a choice about execution. They can work it patiently: split it into smaller pieces, use limit orders, wait for the price they want. That fill type is called SPLIT. Or they can be aggressive: pay the ask right now, route simultaneously across multiple exchanges, get done regardless of slippage. Those are SWEEPs, BLOCKs, and GOLDEN_SWEEPs.
A SWEEP routes a single-direction order across multiple exchanges simultaneously. The practical read: the order was large enough that no single venue could fill it completely, and the buyer didn't want to wait or show their full size on one tape. They swept every venue at once.
A GOLDEN_SWEEP is the same concept at larger notional, often spanning multiple strikes. When you see heavy golden sweep activity on a name, real size moved in a real hurry.
A BLOCK is a large negotiated print, usually executed off-exchange and then reported. Blocks are treated as aggressive in the urgency calculation because the size is notable even when the execution was more controlled. One important caveat: blocks can be hedges. A fund buying 500,000 shares might simultaneously buy puts to protect the position. That protective put trade shows up as a large bearish block. The formula counts it as aggressive. The formula doesn't know it was hedging.
Watch out: BLOCK fills count as aggressive in the urgency formula, but blocks are at least as likely to be hedges as directional bets. A large bearish block on a name that recently ran up sharply is often a fund locking in gains, not a short thesis.
A SPLIT is the patient version. An order worked into the tape over multiple smaller prints, probably to avoid moving the market. Quiet accumulation, or a market maker managing inventory.
There's another dimension to urgency worth naming: time. Short-dated options, particularly those expiring within a week, carry urgency built into their structure. You're paying for the right to buy or sell at a specific price before a specific date, and every day that passes eats at that value. When someone sweeps short-dated options they're not just being aggressive about execution; they're implying something is expected to happen soon. The heat map's urgency score is specifically about execution type, not DTE. But when you're clicking through to confirm a card, check the expiry. A cluster of aggressive fills all targeting next week's options reads differently than aggressive fills spread across multiple expiry dates.
The urgency score formula: what fraction of today's flows for this name came from SWEEP, BLOCK, or GOLDEN_SWEEP fills versus patient ones? Five aggressive fills out of eight total is 62.5%. That's all. Premium size, DTE, and strike have no vote in it.
The score is never printed as a number on any tile. The badge in the corner of each card shows the urgency classification: UNUSUAL means the day's flow pattern is meaningfully above normal activity levels for that ticker. NORMAL means activity is within the typical range. UNKNOWN means insufficient data to classify.
Key point: UNUSUAL means the day's execution pattern is elevated above normal for that ticker. It says nothing about direction. A red UNUSUAL card is elevated bearish flow; a green UNUSUAL card is elevated bullish flow. Badge and color together are the signal.
Why a heat map instead of a feed
The Unusual Activity feed is a list. You scroll, filter, read rows. That's exactly what you want when you're going deep on a specific name or hunting for contracts by DTE and minimum premium. The problem is that reading a list sequentially means you don't see the shape of the day, only the slice you've scrolled through.
The heat map takes the same underlying data and arranges it so the important stuff catches your eye without you having to find it. A hundred tickers' activity becomes a board where size and color do the sorting work. Thirty seconds on this page tells you where the day's premium is concentrating and which direction it's leaning.
One specific advantage: rotation. When three or four names in the same sector all appear colored at the same time, that's a sector story wearing multiple tickers. Reading a feed row by row you might not connect those names. On a visual board that cluster shows up immediately.
The board, top to bottom
Header area
The page title reads "Flow Heat Map" with a flame icon. Underneath: "Biggest premium flows colored by direction: green is net bullish, red is net bearish." When the market is open, a green "Live" label with a pulsing dot appears next to the description. The last-updated timestamp shows when the backend last computed the current snapshot.
Worth noting: the board doesn't require an open market to be useful. Outside of trading hours it shows the previous day's data. Pre-market review of what built up yesterday, before you open anything else, is one of the more useful ways to start a session.
The right side of the header has several controls.
The Watchlist toggle (star button) appears when you're logged in and have tickers saved. Click it to collapse the board to just your watchlist names. Click again to restore everything.
Watch tutorial opens a guided walkthrough of the page. How to Use slides in a sidebar with a condensed explanation and a link back to this guide.
Add to My Desk pins the heat map module to your My Desk dashboard.
The Share button mints a shareable snapshot of the current board state: overall bullish/bearish split, total premium, and ticker count. The link shows a fixed card image, not a live view.
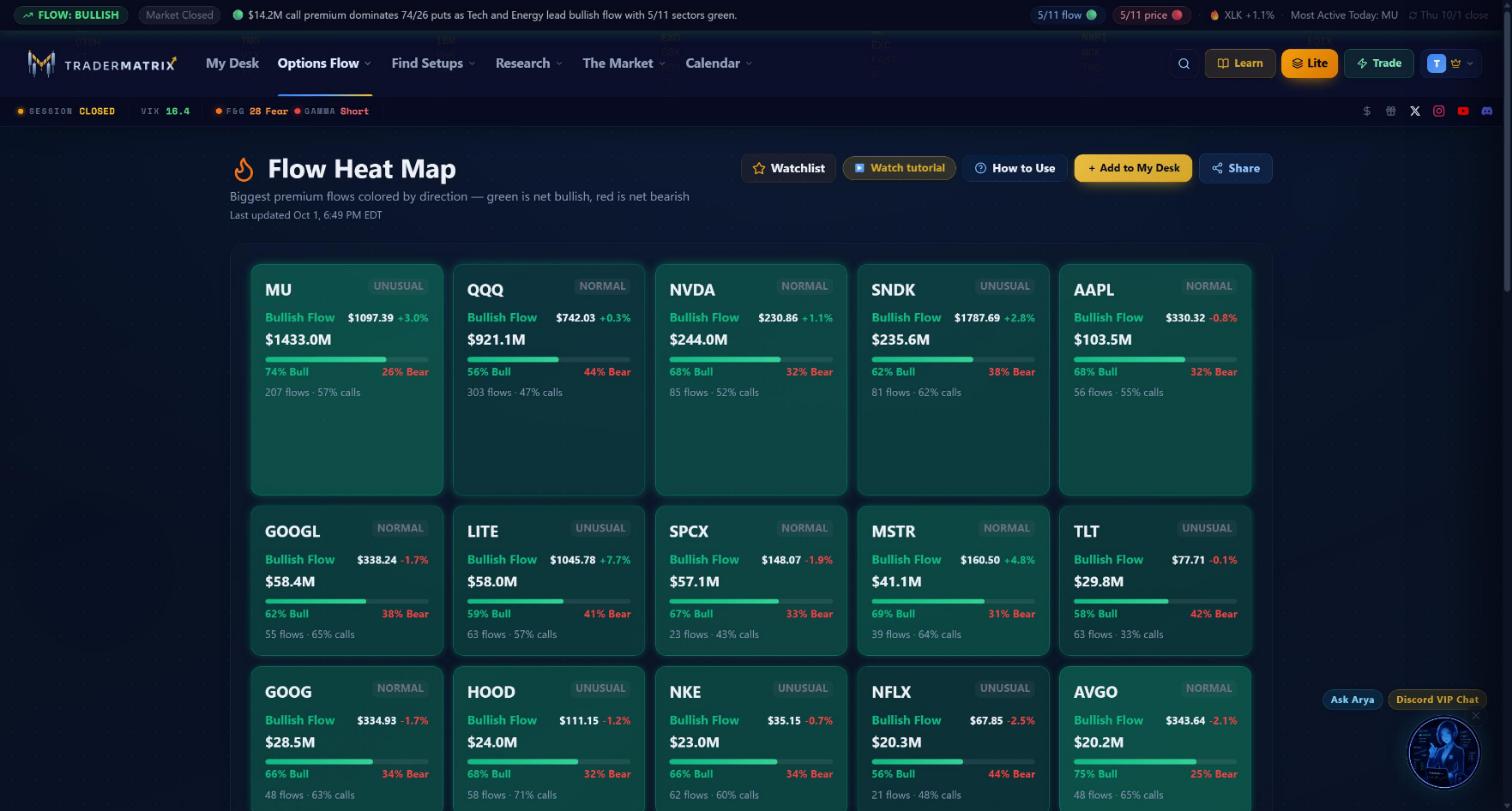 The board after the Oct 1 close. MU leads with $1.43B in premium, UNUSUAL badge, 74% bullish. The top row is all Bullish Flow cards sorted by total premium.
The card grid
Cards arrange in a grid that adapts from two columns on small screens up to five on wide ones. Most desktops see three or four columns.
The order is fixed: all bullish cards first, then all neutral cards, then all bearish cards. Within each group, sorted by total premium descending. There is no sort toggle on the page.
This matters more than it sounds. On Oct 1, SPY had the second-highest total premium on the board at $1.15B and rendered red, bearish. QQQ with $921M was green. So QQQ appeared near the top-left of the bullish group, and SPY landed in the bearish section. The highest-premium card isn't always the one leading the direction. The board's sorting puts directional stories first, regardless of absolute size.
The board shows up to 40 tickers on any given day. The data query caps there, and only names with at least two detected flows qualify. Quiet days might show fewer than 20. Active days fill closer to the cap.
Inside a card
Walking through each field. Here's MU on October 1: $1,433.0M total premium, 74% bullish, UNUSUAL badge, 207 flows.
Top row: ticker symbol on the left. If a name has an upcoming index rebalance event, a small rebalance badge appears next to the symbol, relevant because rebalance-driven flow reads differently from directional flow. On the right, the urgency classification badge. MU shows UNUSUAL in amber. UNUSUAL means the day's flow level is meaningfully above what's typical for this ticker. NORMAL appears in gray for names within their typical activity range. UNKNOWN appears when there isn't enough data to classify.
Second row: direction label on the left ("Bullish Flow" in green). Current price and day percentage change on the right. The price comes from a live batch quote. If the quote wasn't available, the price line just doesn't render; the card still shows.
Third row: total premium in bold ("$1,433.0M"). Dollar total across all flows detected today for this name.
The bar: a horizontal bar below the premium. The green portion is bullish premium divided by total premium. The left label reads "74% Bull." The red portion and right label reads "26% Bear."
This bar is not a call/put split. "74% Bull" means 74% of today's MU premium was classified as bullish flow, based on how the fills hit the tape and the sentiment analysis attached to each print. A name can show 74% bullish premium with 55% puts if those puts were bought in anticipation of a bounce, or as part of a spread, or for any number of other reasons. The bar and the contract volume split answer different questions.
The footer line: "207 flows · 57% calls." Flow count is the number of individual flow events detected today. "57% calls" is the raw call count divided by total contracts: the call/put split by volume, not by dollar premium. When the bar and the footer calls percentage tell the same story (74% bullish premium, 57% calls), that's partial convergence. When they diverge sharply, look closer before you do anything.
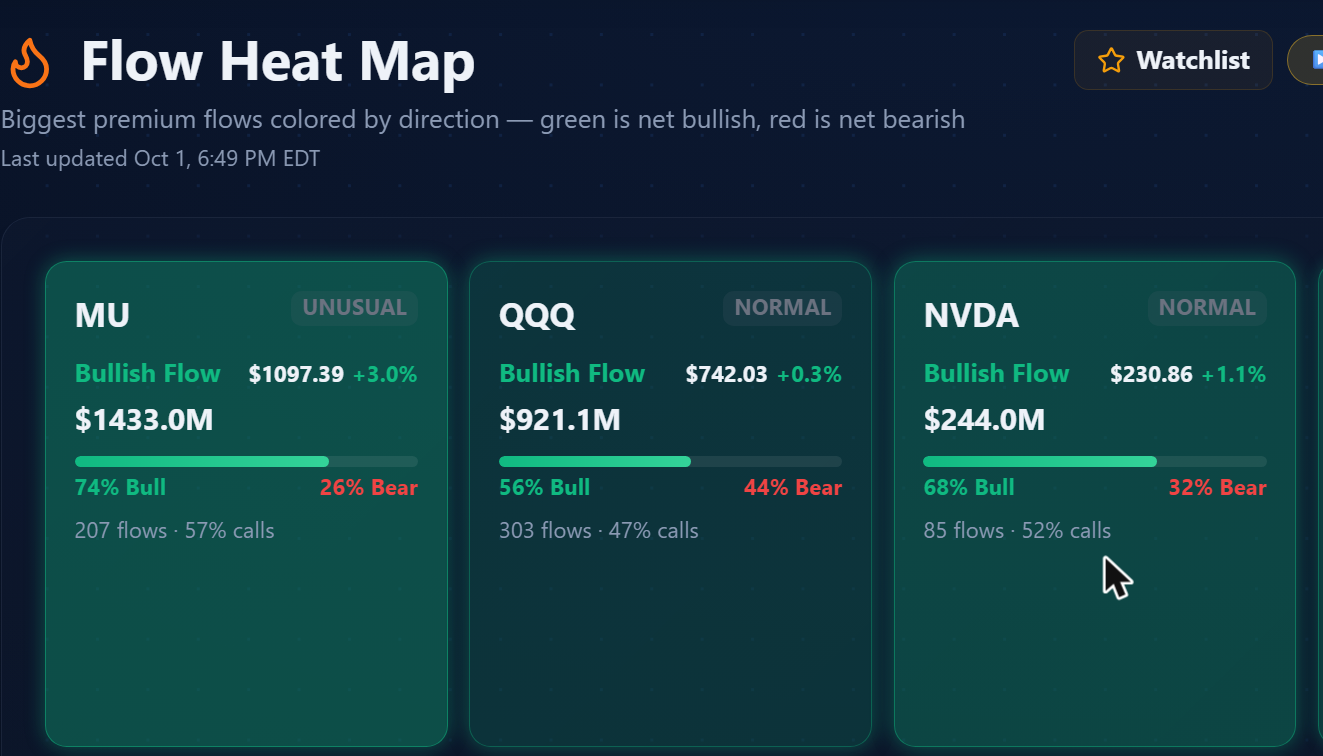 MU has the UNUSUAL badge with 207 flows. QQQ and NVDA show NORMAL despite substantial premium, as their activity level is within typical range for those names.
Card height
Height scales between 150 and 270 pixels, and the only input is total premium relative to the largest card currently visible on the board. The board rescales dynamically: the top premium holder always gets 270 pixels, and everything else scales down proportionally, floored at 150.
A quiet day where the biggest premium is $900K still produces one card at 270 pixels. A busy day where MU carries $1.4B also produces one card at 270 pixels. Absolute dollar amounts don't set the height. The relative ranking within the current board does.
Card color
Sentiment score: bullish premium minus bearish premium, divided by total premium, times 100. Range is -100 to +100.
Above +10: the card renders green. Below -10: the card renders red. Between -10 and +10: neutral gray, no color tint, no glow, regardless of size or urgency. Above +30 intensifies the green. Below -30 intensifies the red. The background opacity also scales with distance from zero, so a score of +12 is a faint wash of green, and a score of +85 is a deeply saturated tile.
The teaching example here is TSLA. On October 1, TSLA had $299.1M in premium, 47% bull and 53% bear, 96 flows: neutral gray. That's not a quiet name with no activity. It's a name where the directional conviction balanced out. Ninety-six detected flows, nearly three hundred million dollars in premium, and the board correctly marks it non-directional. That's the correct read. When TSLA renders gray, the flow for the session hasn't picked a side yet.
Key point: A gray card with large premium and high flow count is a contested name, not a quiet one. TSLA at $299M and 96 flows is gray because the money balanced out directionally, not because nobody showed up.
The glow
The glow is layered on top of color. Neutral gray cards never glow. Only green or red cards can have a glow.
Glow brightness scales with urgency score: no glow at 0%, spreading and intensifying as urgency approaches 100%. At maximum, a strong shadow in the card's own color spreads outward.
Two cards can be the same shade of green while having completely different glow intensities. Same directional lean, different execution story. The large muted green card might be a fund quietly accumulating through patient SPLIT fills all day. The small brightly glowing card next to it might have had every single print come in as a GOLDEN_SWEEP. Same color, completely different urgency signal.
Key point: Color and glow measure different things. Color shows net direction. Glow shows how aggressively the fills came in. Two cards with the same green tint can represent entirely different behavior behind the same lean.
Reading the board: a worked example
Say it's noon. The board shows 24 tiles. Here's what I'm looking at (all hypothetical, internally consistent with the real formulas):
SMCI: $2.1M, green, glowing bright. UNUSUAL badge. "13 flows, 92% calls." Bar reads 89% Bull / 11% Bear.
MU (using real October 1 data): $1,433.0M, green. UNUSUAL badge. "207 flows, 57% calls." 74% Bull / 26% Bear.
TSLA (real October 1 data): $299.1M, gray, no glow. NORMAL badge. "96 flows, 55% calls." 47% Bull / 53% Bear.
TSLA is among the largest cards on the board. It's also neutral and glow-free. The board correctly places it in the middle group, behind every colored card. That's not a malfunction, and it's not a quirk. The board sorted correctly.
MU at $1.4B is interesting for different reasons: that's extreme premium with a clear directional lean and an UNUSUAL badge. 207 flows is a lot. The question when you click through isn't whether buyers were interested, it's whether they were right and whether the positioning was in specific strikes or spread around.
The hypothetical SMCI at $2.1M is the kind of smaller glowing card you're looking for. 89% directional, 13 flows, UNUSUAL badge. It's the specificity that's interesting.
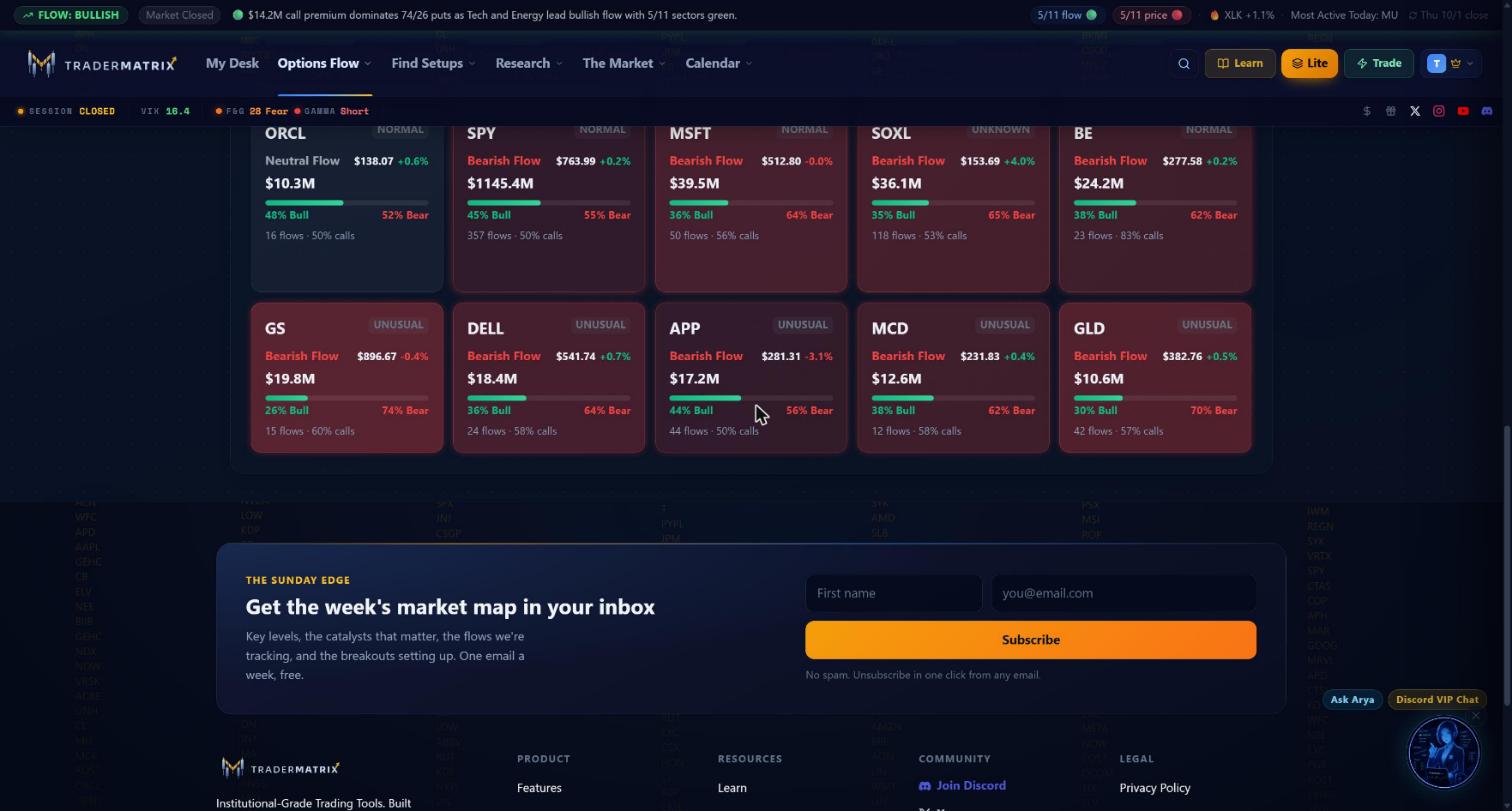 The bearish group on Oct 1. SPY at $1.15B leads the section, the largest red card on the board and the second-largest card overall behind MU's $1.43B. GS and GLD both have UNUSUAL badges on their bearish flow.
What I'd do next: click the SMCI card. The page goes to Ticker Search filtered to SMCI, where I can see the individual prints. If fills cluster around one expiry (say, the $52 calls expiring in November), that's a specific directional target. If the strikes scatter across all available expiries, the read is less clean.
Then I'd check Sector Flow. If the broader tech sector is also leaning bullish, those are two separate data sources pointing at the same story. If the sector is flat while one name is lit, the read is more isolated.
What I wouldn't do: act on the card alone. The card is a filter. It narrows down where to look.
Persistence is what I look for. Say a card appears early with a handful of flows, a green bar and an UNUSUAL badge. If I check back later and it has kept growing, still green, still UNUSUAL, with more flows behind it, that changes the signal meaningfully. A single bright card could be one aggressive print. A card that keeps building is a different thing.
When the board misleads you
The two-flow minimum: a name qualifies for the board with just two detected flows. Two aggressive fills gives 100% urgency score. The UNUSUAL badge fires. The count in the footer matters. A card at "2 flows" is far less interesting than one at "22 flows" with the same badge. Sample size isn't tracked visually. You have to look at the footer.
Watch out: A name qualifies for the board with just two detected flows. Two aggressive fills gives 100% urgency and the UNUSUAL badge fires. Always check the footer flow count before reading urgency on a small card.
Blocks as hedges: BLOCK fills count as aggressive in the formula. But a fund buying 500,000 shares and simultaneously buying puts to hedge that position produces a large bearish block that reads urgent and red on the heat map. The trade was protective. The page doesn't know. This shows up most on names that have recently run up sharply, where fund managers are locking in gains.
Neutral doesn't mean irrelevant: a gray card still attracted enough premium to appear on the board. TSLA with $299M in premium and 96 flows is gray: that's not a quiet day for TSLA, it's a contested day. Some neutral cards reflect genuinely balanced directional views. Others are market makers and spread traders whose two legs balanced out. The board correctly marks these as non-directional, but it doesn't mean the name is asleep.
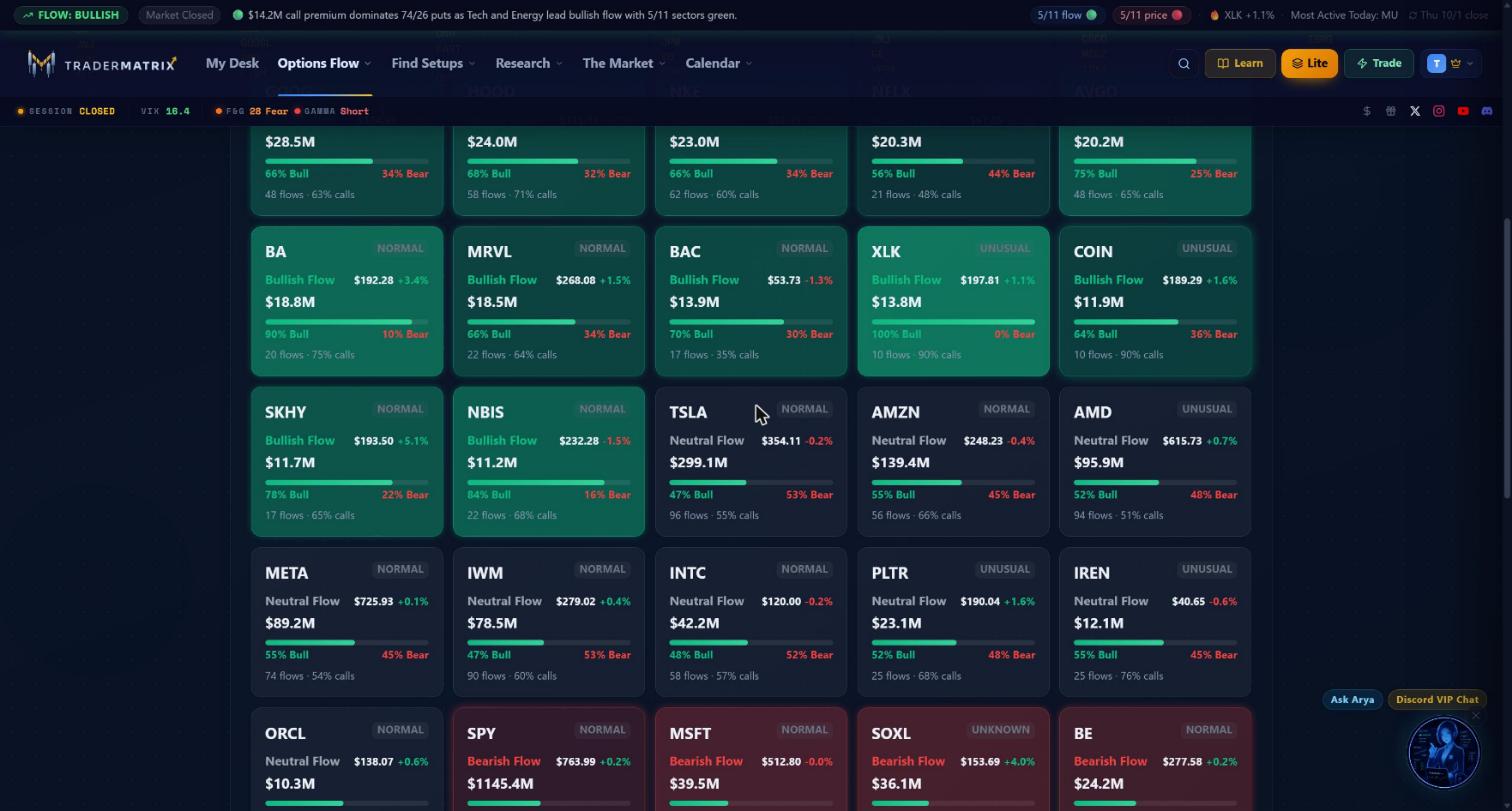 XLK shows 100% Bull on 10 flows with the UNUSUAL badge. An extreme directional read, but a thin sample. TSLA at $299M with 96 flows and 47/53 is the cleaner neutral example.
Early session noise: in the first fifteen minutes of trading you'll sometimes see cards appear quickly and then fade as positioning settles. A card that's bright at 9:35 and gone by 10:00 is a different signal from one that held all morning.
When to pay closer attention
- The card has an UNUSUAL badge and a strong color. Both together are harder to explain away than either alone.
- Flow count is high. A name with 50 to 100 flows and the UNUSUAL badge means buyers kept returning repeatedly through the session.
- The bar and footer calls percentage agree. 80% bullish premium alongside 75% call volume is two separate measurements pointing the same direction.
- The card is in your watchlist. Toggle the star filter; if a tracked name shows colored with an UNUSUAL badge, check that one before any unfamiliar ticker.
- The card has been there for hours. Still colored, still UNUSUAL at noon means sustained buying, not one aggressive print at 9:31.
Try this: Toggle the watchlist filter at the start of each session. If any name you already track appears colored with an UNUSUAL badge, check it before scrolling the full board.
What to skip
- Gray cards, regardless of size. If the premium balanced out directionally, there is no clean directional read.
- Cards with two or three flows. The urgency ratio is too unstable at that sample size and the UNUSUAL badge fires easily.
- NORMAL-badge cards without strong color. Typical execution without a clear directional lean is not what this page surfaces.
- Cards near 40/60 or closer on the bar. Inside that range the direction is ambiguous.
Common mistakes
Reading card size as trade quality: the tallest card is not the best idea. It's the name where the most premium moved. On October 1, SPY's $1.15B card was red and sat in the bearish section. MU's $1.43B card was green and led the board. The interesting cards are often mid-sized with UNUSUAL badges.
Treating the colored bar as a call/put ratio: "78% Bull" is the premium-weighted sentiment split, not the contract volume split. The footer line carries the calls percentage. Both are on every card. They measure different things.
Treating the UNUSUAL badge as a buy signal on its own: UNUSUAL means the day's flow pattern is elevated relative to normal. It doesn't say direction. A red UNUSUAL card (GS on October 1 at 26% bull / 74% bear, 15 flows) is elevated bearish flow. The badge and the color have to agree for there to be a usable read.
Acting on a single morning check: the board is live and changes throughout the day. A card bright at open that faded by noon is a different signal from one still building at 1 pm. Check it at least twice before treating something as a setup.
How it fits with other tools
Unusual Activity uses the same underlying data but as a time-ordered list. Use unusual activity when you want to filter by DTE range or minimum premium, or watch flow arrive on a specific name in real time. Use the heat map when you want the day's picture at a glance.
Live Flow shows the same $20K-plus options tape as a per-ticker roll-up: one card per name with total premium, trade count, a bull/bear split bar, and separate bullish and bearish premium totals. It covers a broader universe than the heat map and lets you sort and filter by sentiment. After spotting something on the heat map, live flow is where you go to see how significant that name's premium is relative to everything else active right now.
Sector Flow zooms out one level: which sectors are attracting premium overall. If three semiconductor names all appear bright green on the heat map at the same time, sector flow should show the same story at the XLK or semiconductor-industry level. Name and sector alignment is a stronger setup than either data point alone.
Dark Pool tracks equity prints, not options flow. Different instrument. But a name showing elevated heat map activity alongside heavy dark pool activity in the underlying is a convergence worth noting.
Earnings Flow specifically tracks positioning around earnings events. A name on the heat map close to its earnings date might be building pre-announcement. Earnings flow will tell you whether the activity has an event context attached to it.
My actual routine with this page
I look at it at three points: around 9:40 after the opening noise settles, around noon, and once in the final hour. Each check is maybe two minutes.
At the open: I note which cards are colored and have the UNUSUAL badge. I don't act on anything yet. I also toggle the watchlist filter to see if any of my tracked names are active today.
Midday: Have the morning cards held? More flows since open, still UNUSUAL, or did the badge downgrade to NORMAL as the session went on? If a name is still building at noon I'll click through to Ticker Search and look at which strikes and expiries the flow is concentrated in.
Final hour: What's still lit going into the close? A card that fades through the afternoon is probably finished. One still accumulating at 3 pm is positioning for overnight or next week.
I use the Share button occasionally when I want to snapshot the board state at a specific moment, useful later for checking whether a setup actually played out the way the flow was suggesting.
One thing worth sitting with
Here's something I genuinely don't know the answer to: does a card with an UNUSUAL badge and strong color reliably predict the underlying stock going up?
Probably yes, more often than random chance. An aggressive buyer sweeping multiple exchanges to own calls is expressing real conviction with real capital behind it. That's information.
What it doesn't tell you is whether the buyer was right. The UNUSUAL badge fires based on elevated aggressive fills. It doesn't fire harder because those buyers were correct. A name can carry UNUSUAL status all session and gap down the next morning on news that had nothing to do with the options flow.
Flow shows conviction and timing. It doesn't show outcome. How well urgency score actually correlates with directional results across different market conditions and different sectors is a question I don't have a clean answer to. That one stays open for now.
Options carry substantial risk including total loss of premium paid. Nothing in this guide is a recommendation to buy or sell any security. Past flow patterns don't predict future results.