Options Flow deep dive · 11 min read
How to Use the Options Profit Calculator
A walkthrough of the free options profit calculator: build a multi-leg trade on any ticker, read the breakeven, max loss and chance of profit, drag the what-if sliders, and let the strategy finder rank all 12 strategies against your price target.
Open the tool →Hey guys, Art from TraderMatrix here. Most new options traders place a trade first and find out what it can lose second. The calculator exists to flip that order. It's free and needs no account, and you can have a real trade on the screen in about ten seconds.
Everything below uses AAPL at $247.10 from the October 12, 2026 session. Your numbers will differ because the stock will have moved, but every screen works the same way.
The short version:
- Pick a ticker, pick one of 12 starting strategies, and the calculator fills in the legs with prices from the options chain.
- The five numbers that matter sit above the chart: net debit or credit, max profit, max loss, breakeven and chance of profit.
- The What-if sliders show what the trade is worth if price, time or implied volatility change.
- The Strategy finder takes a price target and ranks all 12 strategies against it.
- A field marked "est. IV %" means the calculator is estimating volatility, not reading it off the chain.
Where to find it
The calculator lives at /calculator. In the main menu it sits under Options Flow, in its own column. You don't need to log in, and nothing you build is saved to an account. If you want to keep a trade, the Copy link button saves the whole setup into the URL.
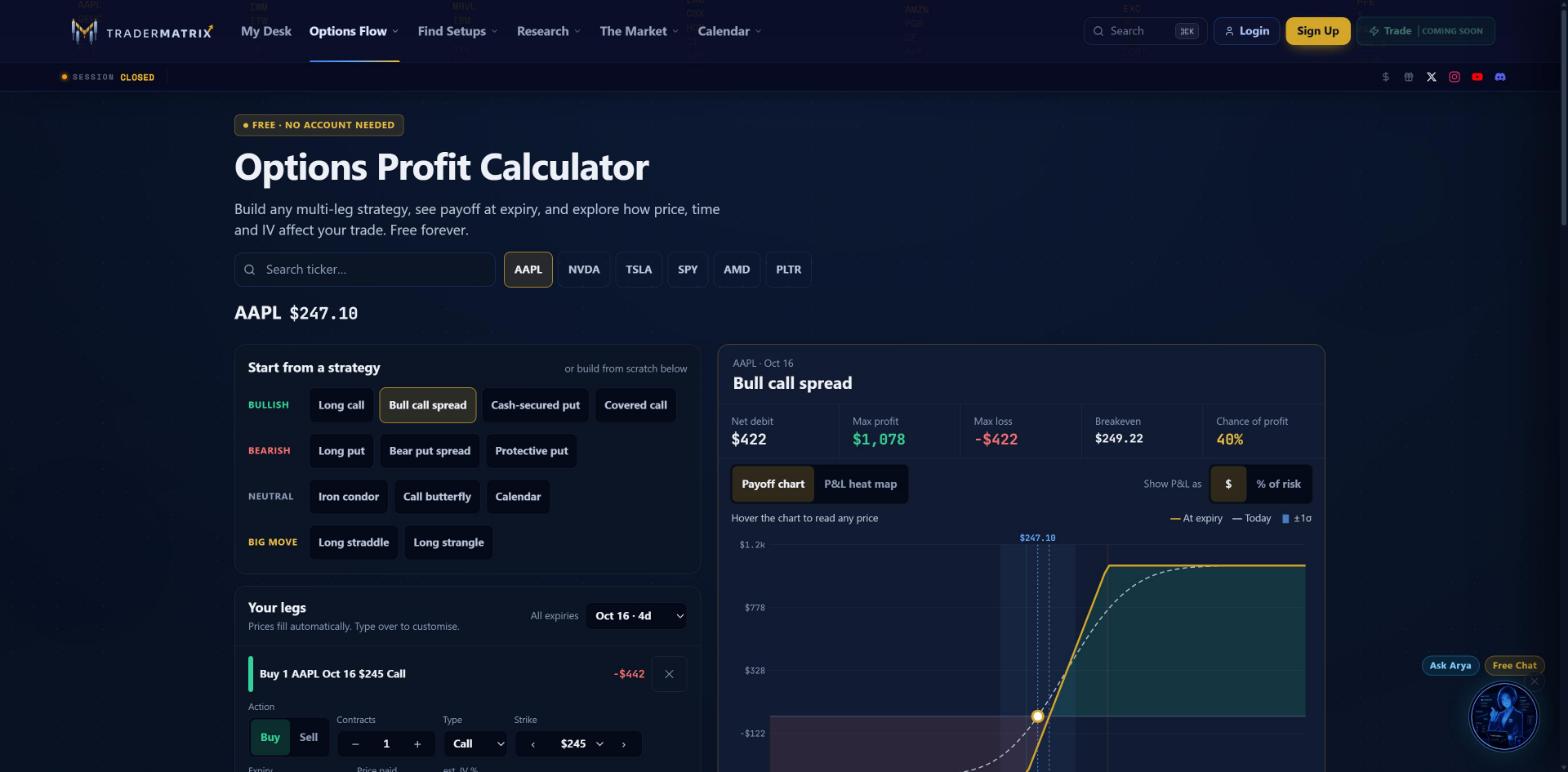 The top of the page. AAPL is the default ticker. The chips next to the search box jump straight to NVDA, TSLA, SPY, AMD or PLTR.
Type any ticker into the search box and the page loads its price and its option expirations. The chips are shortcuts, nothing more.
Start from a strategy
The "Start from a strategy" card holds 12 buttons in four groups:
- Bullish: Long call, Bull call spread, Cash-secured put, Covered call
- Bearish: Long put, Bear put spread, Protective put
- Neutral: Iron condor, Call butterfly, Calendar
- Big move: Long straddle, Long strangle
Click one and the calculator builds the legs for you around the current price, using the nearest expiration. It also prices every leg from the options chain, so you're not typing in guesses. If you want to start from nothing, ignore the buttons and use the + Call, + Put and + 100 shares buttons under the leg list.
I clicked Bull call spread. That's a debit trade: you buy a call, you sell a higher call against it, and you pay a net amount for the pair.
Reading your legs
Under the buttons, the "Your legs" card shows one row per leg.
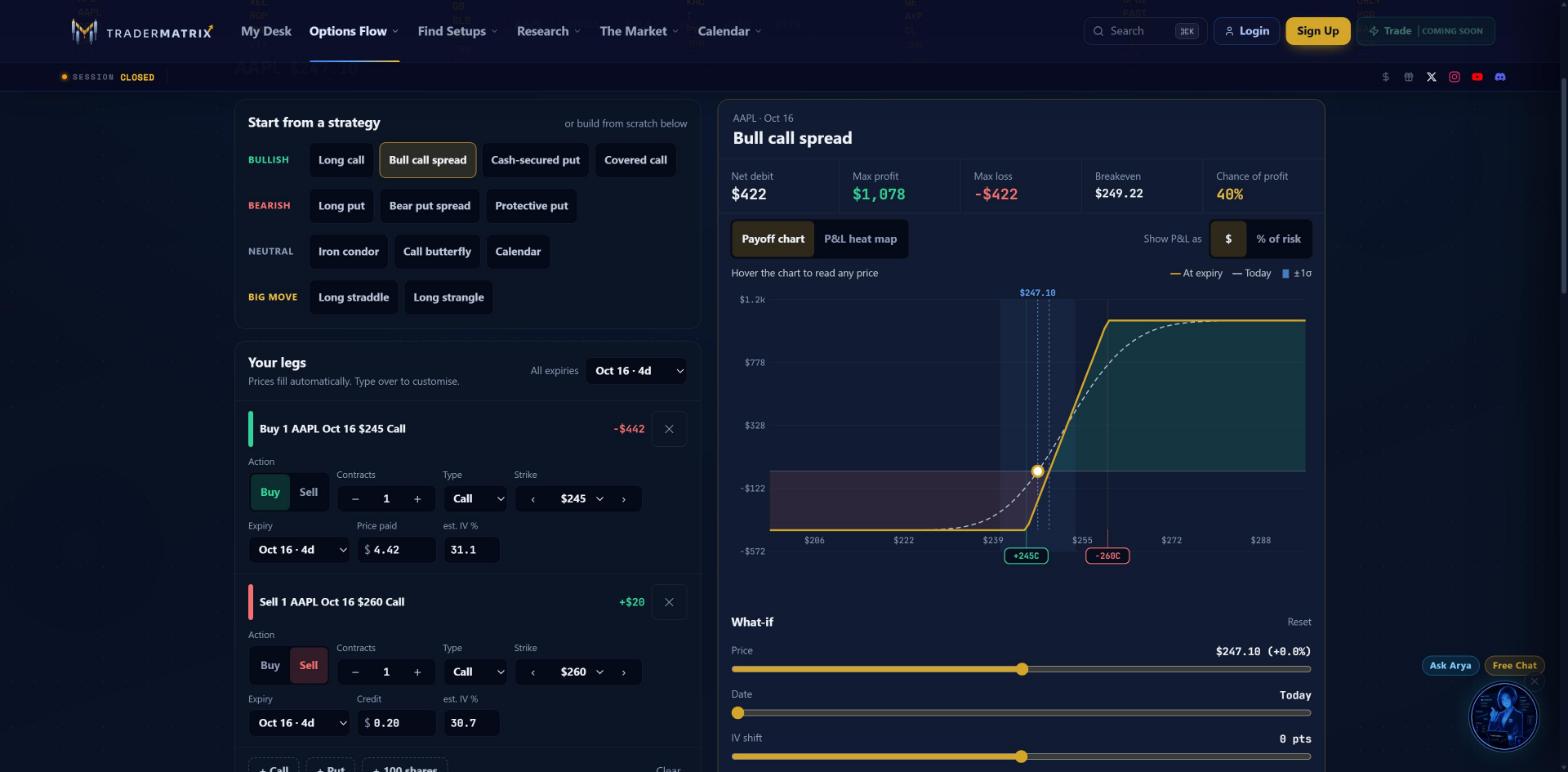 Buy 1 AAPL Oct 16 $245 Call at $4.42, sell 1 AAPL Oct 16 $260 Call at $0.20. The chart on the right redraws every time you change a field.
Each row has the same controls:
- Action. Buy or Sell. A sold leg shows a green credit; a bought leg shows a red cost.
- Contracts. Each contract covers 100 shares, so one contract of a $4.42 option costs $442.
- Type and Strike. Call, put or shares. The arrows beside the strike step it to the next listed strike.
- Expiry. Each leg can have its own date. That's how the Calendar strategy works, and the "All expiries" menu at the top of the card moves every leg at once.
- Price paid or Credit. This fills in on its own. Type over it if you got a different fill, and the whole page recalculates around your number.
- est. IV %. The implied volatility the calculator uses to price that leg.
That last label deserves a second look. When the field reads "est. IV %", the calculator is estimating volatility instead of taking the chain's own figure. The estimate is usually close, but it's an estimate. If you've got the real number from your broker, type it in.
The five numbers above the chart
This is the part I'd read before looking at anything else.
| Number | What it means | Bull call spread |
|---|---|---|
| Net debit | What you pay to open the trade | $422 |
| Max profit | Best case at expiration | $1,078 |
| Max loss | Worst case at expiration | -$422 |
| Breakeven | Price where the trade makes $0 at expiration | $249.22 |
| Chance of profit | Odds the trade finishes above breakeven | 40% |
Check the arithmetic once, because it's the fastest way to trust the tool. The two strikes are $15 apart, and one contract covers 100 shares, so the spread can be worth at most $1,500. You paid $422. The most you can make is $1,500 minus $422, which is $1,078. The most you can lose is the $422 you paid. The breakeven is the $245 strike plus the $4.22 net cost per share.
The 40% is the one people argue with, so here's how it's built. The calculator takes the at-the-money implied volatility, assumes the stock's return at expiration follows a log-normal distribution, and counts how much of that distribution sits above your breakeven. It's a model. It isn't a forecast, and it doesn't know about earnings dates or news. It also uses one volatility number for the whole trade, while the far strikes of a wide trade usually trade at a different IV. How much that skews the 40% depends on the trade, and the calculator doesn't say.
Watch out: A low chance of profit isn't a reason to skip a trade, and a high one isn't a reason to take it. This spread has a 40% chance of profit and a 2.6-to-1 payoff. The iron condor further down has a 93% chance of profit and loses almost 38 times what it can make. Read the chance of profit next to max profit and max loss, never alone.
Reading the payoff chart
The chart plots profit and loss against the price of the stock at expiration.
- The gold line is your P&L at expiration. Below $245 you lose the whole $422. Above $260 you make the full $1,078.
- The dashed line is your P&L today, before expiration. It's smoother because time value is still in the options.
- The blue band marks one standard deviation, the range the stock is expected to stay inside about two-thirds of the time.
- The vertical lines and tags mark each strike, like +245C and -260C.
- The white dot is the current stock price.
Hover anywhere on the chart to read the P&L at that price. Drag a strike tag left or right to move that leg to a different strike, and the stats update as you drag. The $ and % of risk buttons switch the axis between dollars and a percentage of what you could lose.
A credit trade: the iron condor
If you only ever buy options, skip ahead to the heat map. Everyone else, click Iron condor to see what a credit trade looks like.
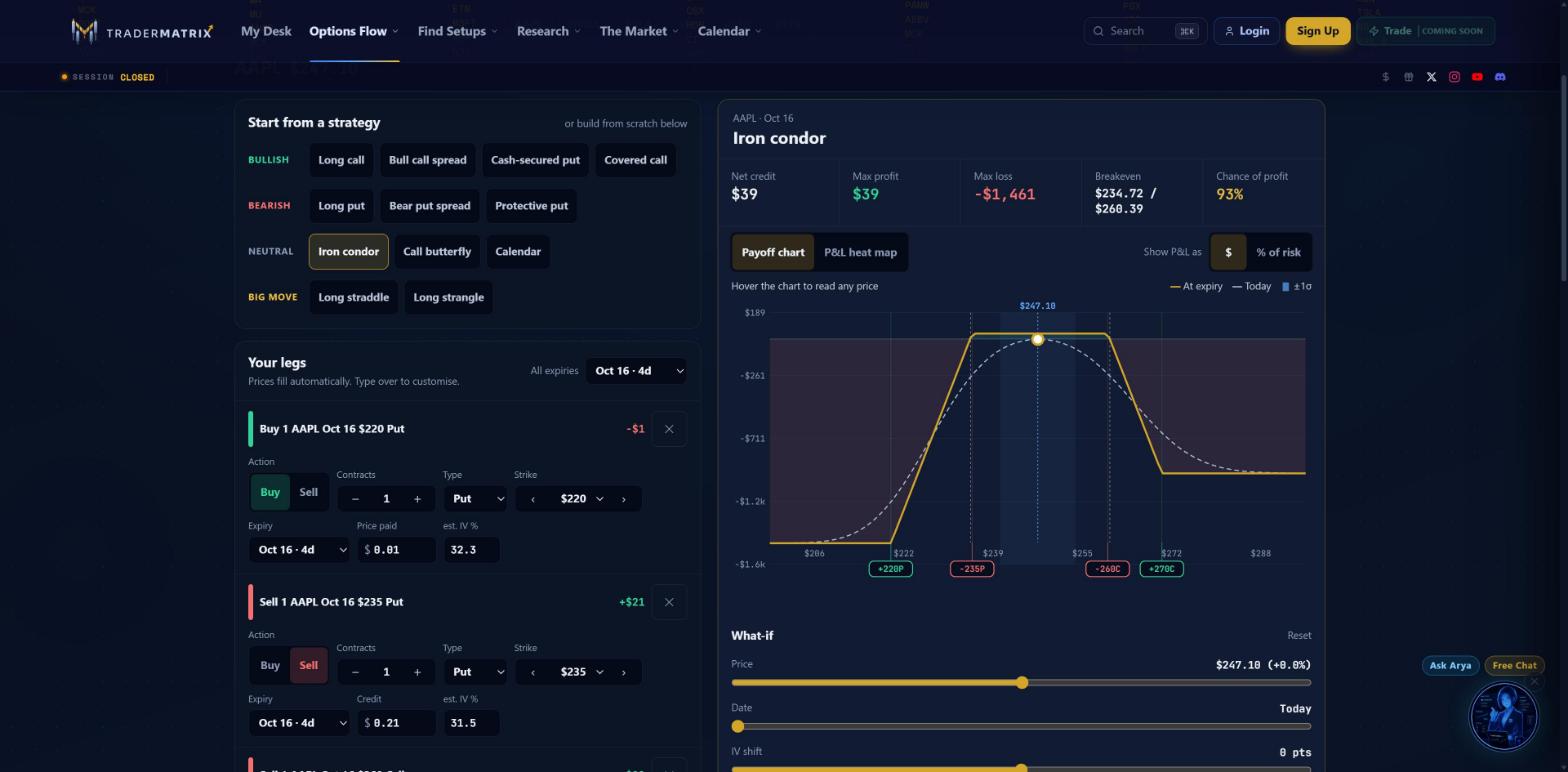 An iron condor sells a put spread and a call spread at the same time. You collect a small credit up front and keep it if the stock stays between the two short strikes.
Two things changed. The first stat now says Net credit, because you're collecting money instead of paying it. The second is that there are two breakevens, $234.72 and $260.39, because the trade can lose on either side.
Now look at the risk. The wings are $15 wide, so the worst case is $1,500 minus the $39 credit, which is $1,461. You're risking $1,461 to make $39. That 93% chance of profit is real, and it's also exactly why the payoff is so lopsided. If you sell premium, this is the chart to keep open.
The P&L heat map
Click "P&L heat map" above the chart and the lines turn into a grid.
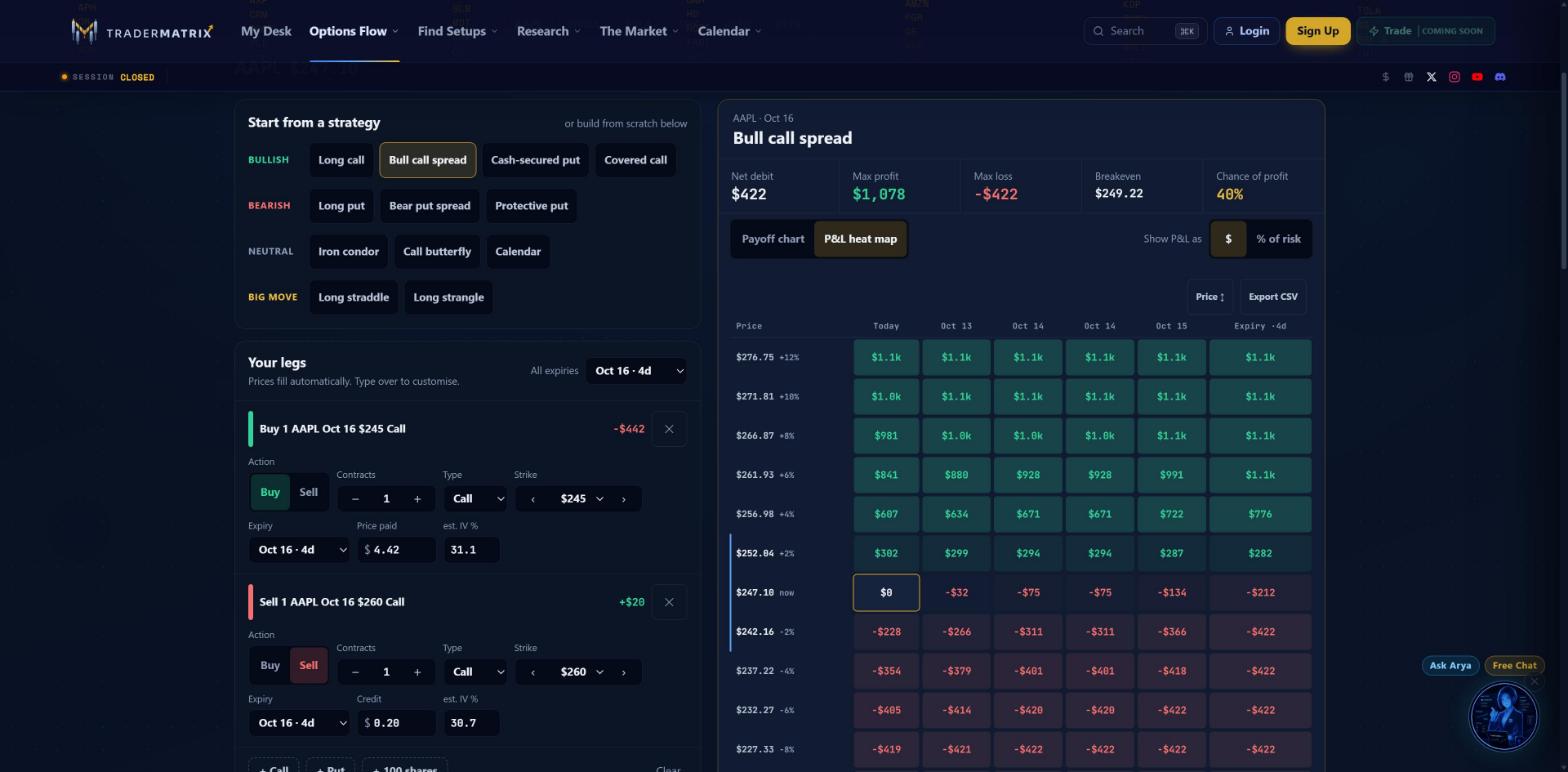 Prices down the side, dates across the top. The "now" row at $247.10 is outlined.
Each cell answers one question: if the stock is at this price on this date, what is the trade worth? Green is profit, red is loss, and the number sits inside the cell so you're never relying on color alone. The left column runs from 12% above the current price to 8% below it, and the last column is expiration.
The Price button sorts the rows, and Export CSV downloads the grid so you can drop it into a spreadsheet.
I like the heat map for time decay. Read across the "now" row: $0 today, -$32 tomorrow, -$212 by expiration. Nothing happened to the stock. The trade just got older.
What-if sliders and Greeks
Scroll below the chart and you'll find the What-if card.
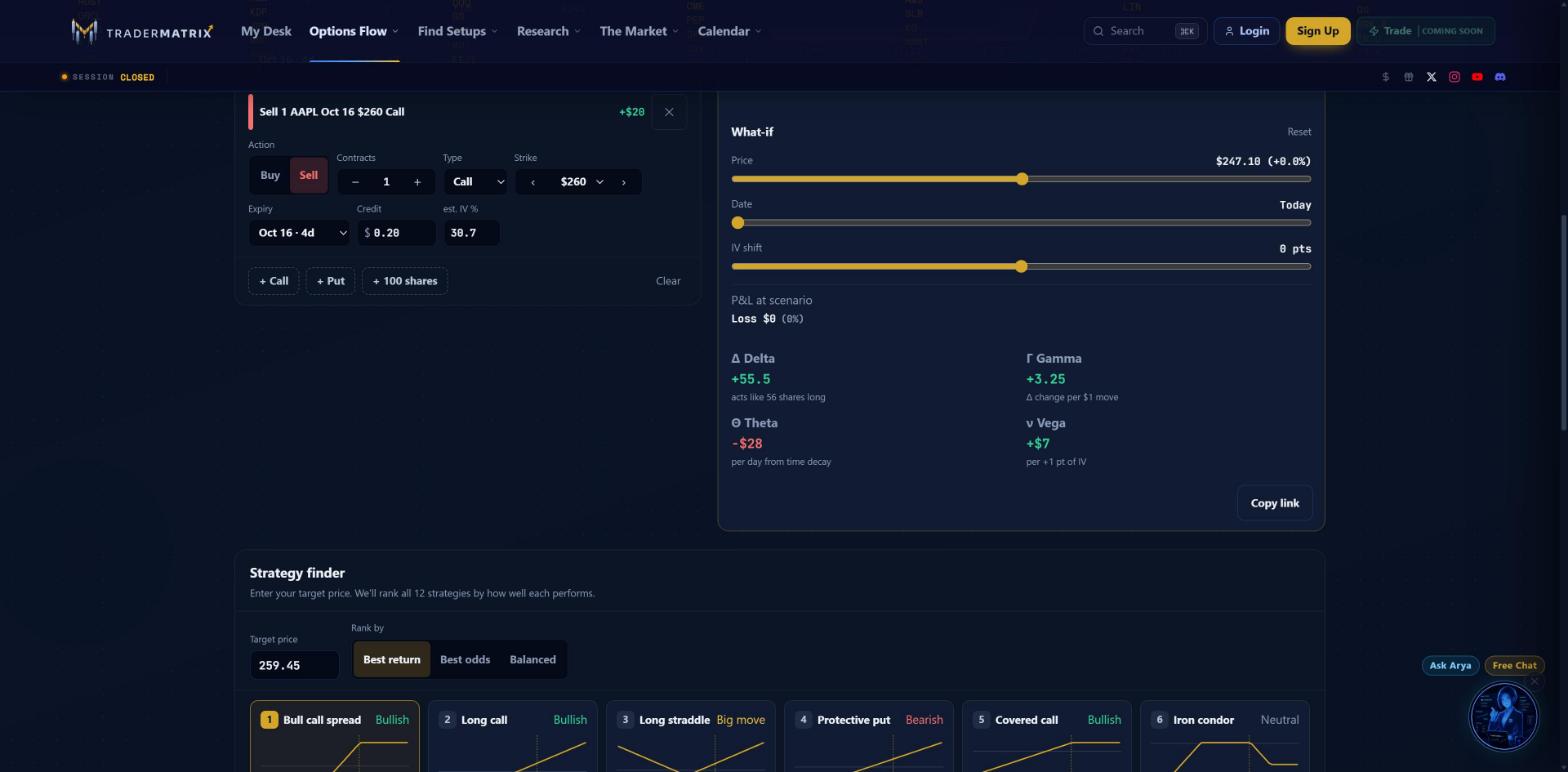 The three sliders sit at their defaults here: today's price, today's date, no change in volatility.
There are three sliders:
- Price moves the stock up or down from where it is now.
- Date moves time forward toward expiration.
- IV shift raises or lowers implied volatility in points.
Under the sliders, "P&L at scenario" tells you what the trade is worth with all three applied, and the white dot on the chart follows along. Reset puts everything back.
Below that are the four Greeks for your whole position:
- Delta (+55.5). The trade behaves like owning about 56 shares. If AAPL rises $1, you gain roughly $55.
- Gamma (+3.25). How much that delta changes for each $1 move.
- Theta (-$28). What the trade loses each day to time decay, all else equal.
- Vega (+$7). What the trade gains if implied volatility rises one point.
These are position totals in dollars, not per-share figures, so you can compare strategies directly. The Copy link button under the Greeks stores the ticker and every leg in the URL. Paste it into a message and whoever opens it sees exactly your trade.
The Strategy finder
The last tool on the page is the one I'd use when I have a view but not a trade.
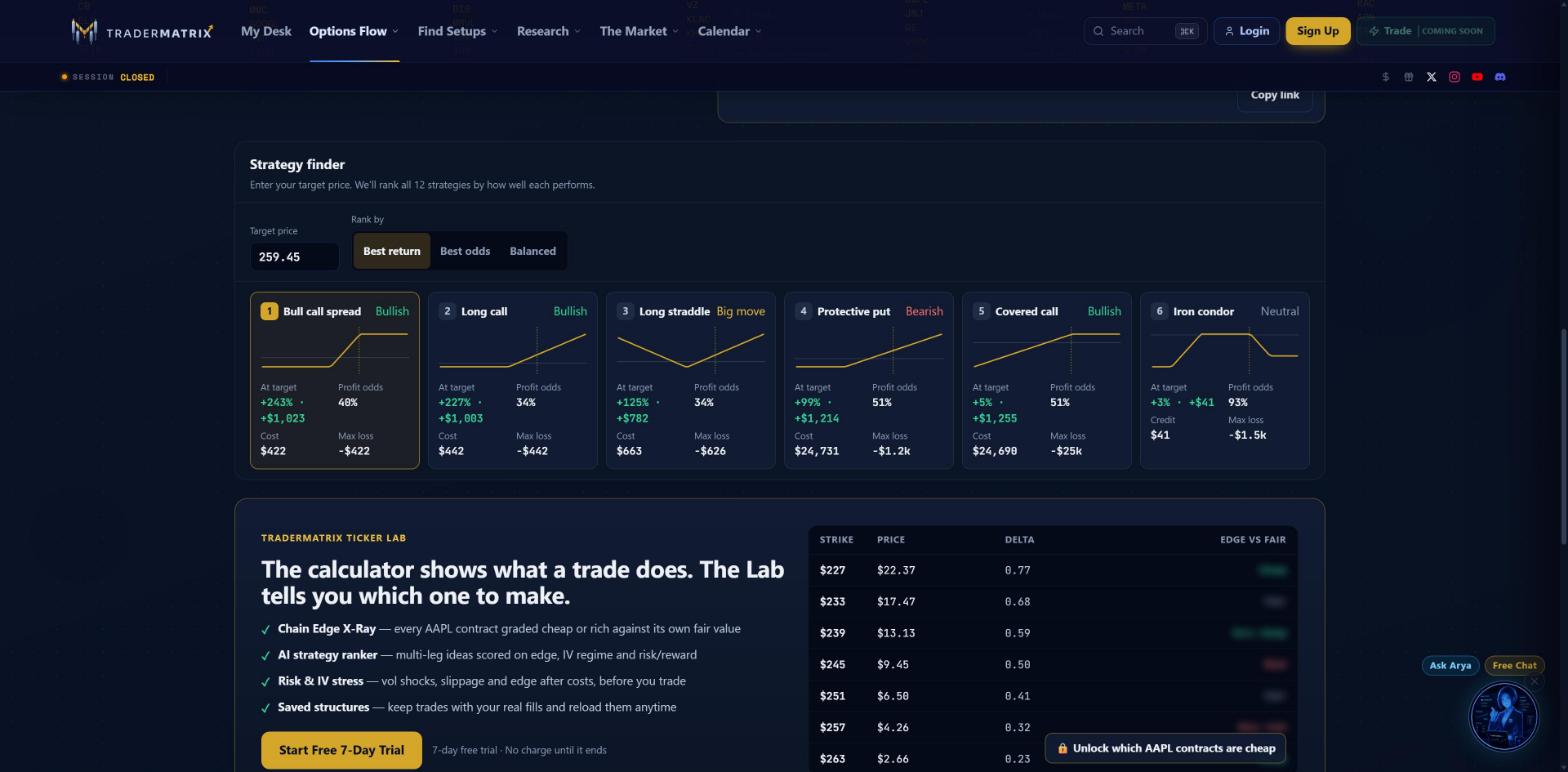 Target price $259.45, ranked by best return. The bull call spread comes first at +243%, and the long call is second.
Type a target price and pick how to rank. Best return orders strategies by how much they make if the stock gets there. Best odds orders them by chance of profit. Balanced weighs both. Each card shows a mini payoff chart, the return at your target, the profit odds, the cost, and the max loss.
Read the percentage carefully. It's the profit at your target divided by the most the trade can lose. The bull call spread risks $422 to make $1,023, which is +243%. The protective put and the covered call both include 100 shares of AAPL, so they cost about $24,700 each. The protective put's loss is capped near $1.2k, so $1,214 of profit shows as +99%. The covered call can lose nearly the whole $25k, so $1,255 of profit shows as +5%. Two similar dollar gains, very different percentages. Compare the dollar profit and the max loss side by side before you trust the ranking.
Watch out: The finder assumes you're right. "Best return" at a target price is the return if the stock lands on your number, not the odds it does. Check the Profit odds line on every card before you pick one.
Click a card and the calculator loads that strategy into the legs list, so you can edit it from there.
Where the calculator stops and the Ticker Lab starts
The calculator shows you what a trade does. It can't tell you whether the options you're buying are priced fairly. If you're a paying member, the Ticker Lab grades every contract on the chain as cheap or rich against its own fair value, ranks strategies around your plan, and stress-tests the one you pick. Paying members don't see the promo panel at the bottom of the calculator, because they already have the Lab.
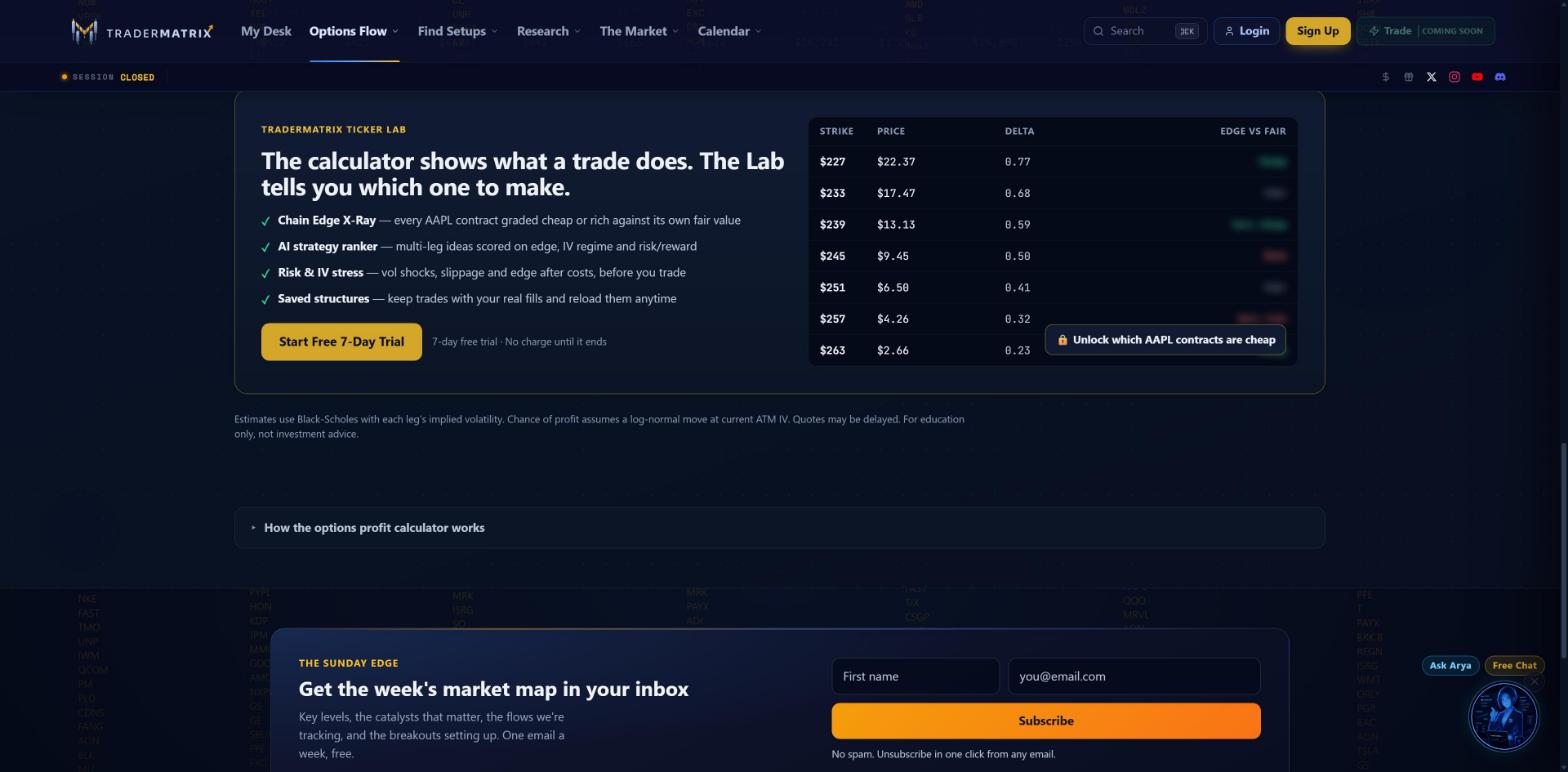 The edge column is blurred on purpose. The calculator models any trade you give it; the Lab tells you which contracts are worth giving it.
The small print under the panel matters too. Estimates use Black-Scholes with each leg's implied volatility, chance of profit assumes a log-normal move at the current at-the-money IV, and this is education, not investment advice.
A quick way to practice
For the strategies behind the buttons, the Covered Calls and Cash-Secured Puts guides go deeper, and the DTE and implied volatility pages cover the two inputs that move these numbers most. When you want to know which contracts are worth putting into the calculator, open the Ticker Lab.
Try this once:
- Load a stock you follow and click Long call. Note the max loss.
- Click Bull call spread. Notice the max loss shrinks and so does the max profit.
- Drag the Date slider to expiration and watch the dashed line fall onto the gold one.
- Open the heat map and find the cell where you break even.
- Enter a target price in the Strategy finder and see which strategy it ranks first.