
Options Screeners deep dive · 16 min read
How to Use the Covered Calls Screener
A plain-English guide to the Covered Calls screener inside the Wheel Tracker: how it ranks the best call to sell against every share lot you hold, how the three-factor grade is built from verified formulas, and what the staleness and earnings-inside-expiry flags actually mean before you act.
Open the tool →Hey guys, Art from TraderMatrix here. Most covered call tools hand you a screener full of tickers from the broad market and let you filter by IV or yield. That's fine, but it starts from the wrong question. What you actually want to know is: of the names I already own, which one is the best call to sell right now, and at exactly which strike?
That's what the Covered Calls screener inside the Wheel Tracker does. It reads your own share lots, finds the best call strike against each one, scores every recommendation by a three-factor composite, and ranks the whole list so the strongest opportunity floats to the top. Everything ties back to your holdings and your cost basis, not some generic universe.
Before we look at the page, I want to explain what covered calls actually do, because the mechanics affect every number you'll see in the screener.
The short version:
- This screener reads your actual share lots, not a generic ticker universe.
- Every recommended strike must sit above your cost basis; strikes below it are filtered out automatically.
- A STALE badge on a JOURNAL lot means verify you still own the shares before acting on that row.
- Earnings inside the expiry window triggers an F grade override regardless of what the score would be.
- Grade A with 20 to 45 DTE and no earnings flag is the cleanest combination in the screener.
What a covered call actually is
A covered call is a contract where you agree to sell 100 shares at a fixed price (the strike) by a fixed date (the expiry), in exchange for a cash premium paid to you today. Your shares are what makes the call "covered." You're not promising to deliver shares you don't have; you're promising to sell shares you already own.
There are four things to hold in your head when you read screener output.
Assignment. If the stock closes above the strike at expiry, your shares get called away. You deliver them at the strike price and keep the premium regardless of where the stock goes. If you wrote a $42 call and the stock closes at $48, you sell at $42. The extra $6 belongs to whoever bought the call. That's the deal.
Upside cap. From the moment you sell the call, your maximum gain on those 100 shares during the contract's life is locked to roughly the strike plus the premium. Covered calls make sense when you'd be happy selling the shares at a slight premium to where they are now. If you're bullish and think the stock is heading significantly higher, selling a call competes with that thesis.
Cost basis. Your cost basis is what you actually paid for the shares, possibly adjusted down by premiums collected over prior cycles. If you were assigned from a cash-secured put at $40 and collected $2 in premium over two covered calls that expired worthless, your effective (wheeled) basis might sit around $36 or $37. The screener uses your cost basis, not the current market price, as the reference for everything. A strike above the current market price but below your cost basis doesn't generate income; it locks in a loss at assignment. The screener filters those out automatically.
Rolling. Rolling means closing an existing call before expiry and opening a new one, usually further out in time. You roll for a credit when you want to extend income without giving up the shares. You roll up and out when the stock has moved close to or into the money and you want a higher strike at a later expiry. Rolling is a technique for managing a live position, not an escape hatch, and every roll costs a transaction with a new bid-ask spread.
One more thing before we look at the page: American-style equity options can be exercised early. Deep in-the-money calls going into an ex-dividend date carry real early-assignment risk, because the counterparty can exercise early to capture the dividend.
Watch out: The screener flags earnings inside the expiry window but not ex-dividend dates. If you have a deep ITM call open the day before an ex-div date on a name with a meaningful dividend, check the dividend calendar yourself before that date arrives. Early assignment on a deep ITM call is possible and the screener won't warn you.
How to get to the screener
The screener lives inside the Wheel Tracker at /wheel. Open that page and you'll see the "Wheel Tracker" header with a subtitle about the CSP to CC lifecycle and weekly premium progress. A row of action buttons sits below it.
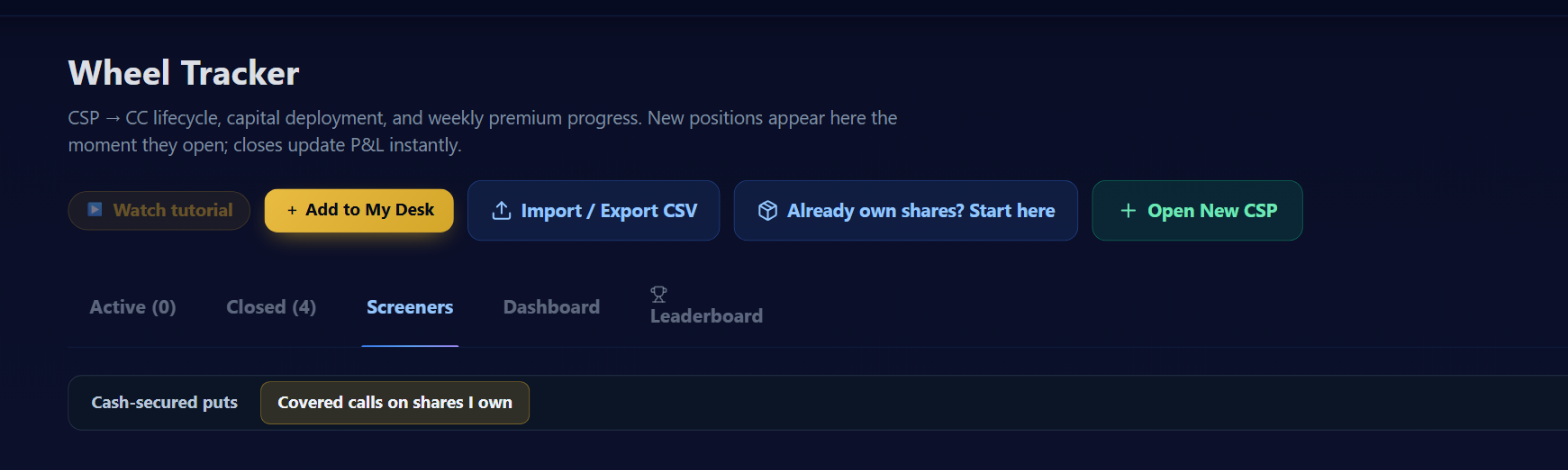 The Screeners tab with "Covered calls on shares I own" selected, from the October 1, 2026 session. The tab bar shows Active (0), Closed (4), Screeners, Dashboard, and Leaderboard. Five action buttons appear above the tabs: Watch tutorial, Add to My Desk, Import / Export CSV, Already own shares? Start here, and Open New CSP.
The button row shows: Watch tutorial, Add to My Desk, Import / Export CSV, "Already own shares? Start here," and Open New CSP. That "Already own shares? Start here" button matters if you hold shares that weren't acquired through the Wheel Tracker. Click it, register the ticker and your cost basis, and the screener picks them up on the next scan.
Below the buttons are tabs: Active, Closed, Screeners, Dashboard, and Leaderboard. Click Screeners and you get two sub-tabs: Cash-secured puts and Covered calls on shares I own. Select the second one.
The card at the top reads "Best covered call on what you own," with the subtitle "Every share lot you hold, ranked by the strongest call to sell against it. Strikes sit above your cost basis; earnings inside the expiry are flagged." The Re-scan button forces a fresh run even when a recent result is available.
Where your holdings come from
The screener builds your holding list from two sources, and each row tags which one it came from.
WHEEL lots are positions where a cash-secured put you tracked inside the Wheel Tracker got assigned. The tracker spawns a linked covered call position and records the assignment price as the cost basis. These lots are always current because the Wheel Tracker owns their full state lifecycle.
JOURNAL lots are share positions visible in your Trade Journal as open long stock entries, not from a Wheel Tracker assignment. If you bought 300 shares of something a few months ago and logged the trade, the screener sees those shares. The "Already own shares? Start here" path also writes holdings into the journal for the screener to find.
The screener looks for open long stock positions in the journal with 100 or more shares and a known entry price, using that entry price as the cost basis.
The stale flag
JOURNAL-sourced lots can carry a STALE warning. If a journal entry for a share position hasn't been updated in 90 or more days, the screener flags it stale.
A stale row is not hidden. The screener still shows it, because a long-term holder legitimately has old lots, and silently dropping them would create its own problems. The flag is asking: do you still actually hold these shares? Did you sell them somewhere the journal doesn't know about?
This matters more than it might look at first. A covered call against shares you no longer own is a naked call, not a covered one. A naked short call has uncapped theoretical loss. As of mid-September 2026, about 31% of open long stock rows in the journal were 90 or more days old without any update. That's a meaningful fraction of "holdings" that may not be current.
Watch out: Verify the position before you act on any recommendation from a STALE row. A covered call against shares you no longer own is a naked call, and that's not a minor distinction. WHEEL lots never carry the stale flag because the Wheel Tracker's state machine tracks exactly where those positions are in the lifecycle.
The scan processes up to 12 holdings per run. Holdings beyond 12 are listed but not scored.
Row anatomy
Each row pairs one of your holdings with the best call the system found against it.
- Ticker and source tag: the symbol, followed by WHEEL or JOURNAL. If the lot is stale, a STALE badge appears next to the source tag.
- YOU HOLD: share count and cost basis per share. Every calculation in the row ties back to this number.
- BEST CALL: the top-ranked strike recommendation. Shows the strike, expiry date, days to expiry (DTE), and the percent the strike sits above your cost basis. Strikes must sit above your cost basis; the screener filters any strike at or below your basis before scoring begins.
- PREMIUM: the mid-market premium per contract. One contract covers 100 shares, so the per-contract figure is the per-share premium times 100.
- ANN. RETURN: the annualized return, which normalizes different DTE calls onto the same scale. A 14-day call and a 45-day call that look similar in absolute premium are very different trades when annualized, and this column makes that comparison honest.
- GRADE: a letter from A to F based on the three-factor composite score.
- Earnings flag: if an earnings report falls between today and the expiry date, the flag appears with the date. When earnings falls inside the expiry window, the screener applies a hard veto: score becomes zero and grade becomes F, regardless of anything else.
- Pick strike: opens a detail view showing all scored candidate calls the screener evaluated for that holding. You can select a different strike than the top recommendation and log it as a new covered call position.
How the grade is built
The composite score has three components:
- Annualized ROC: 40%
- Delta sweet spot: 40%
- Upside cushion: 20%
Annualized ROC (40%). ROC is premium divided by strike as a percentage over the life of the contract, then scaled to 365 days: (premium / strike) times 100 times (365 / DTE). The scoring function maps that annualized percentage to a 0-100 score: min(annualized ROC times 2, 100). So 50% annualized ROC scores a perfect 100. Anything above 50% still caps at 100. That ceiling is deliberate. Very high annualized returns typically come from very short DTE with elevated IV, often reflecting a specific event, and the scoring doesn't let those outlier yields crowd out well-balanced calls at sensible yields.
Delta sweet spot (40%). The scoring function treats 0.30 as the ideal delta. Delta is roughly the probability the option finishes in the money, so a 0.30 delta call has about a 30% chance of assignment. The further the actual delta sits from 0.30, the more score this component loses. The formula: each 0.01 away from 0.30 costs 3.33 score points. A delta of 0.20 is 0.10 away from 0.30, costing 33 points. Same on the other side at 0.40.
Deep OTM calls (delta 0.10 or lower) collect very little premium because the market prices assignment as unlikely. Deep ITM calls (delta 0.50 or higher) collect substantial premium but cap shares very close to where they're trading. The 0.30 zone is where you can collect meaningful income without writing a strike so tight that assignment is nearly certain.
Upside cushion (20%). This scores how far the strike sits above your cost basis as a percentage. It peaks at 100 when the strike is exactly 5% above basis, and tapers off in both directions. The formula: score = max(0, 100 minus 10 times the absolute distance from 5%). A strike 1% above basis scores about 60. A strike 10% above basis scores about 50. A strike 15% above basis scores 0. Anything above 25% also scores 0. The screener favors strikes where the cushion is real but not so wide that the premium has become thin.
The composite: 0.40 times ROC score, plus 0.40 times delta score, plus 0.20 times upside score.
| Composite score | Grade |
|---|---|
| 80 and above | A |
| 65 to 79 | B |
| 50 to 64 | C |
| 35 to 49 | D |
| Below 35 | F |
A Grade A means all three components are pulling in the same direction at the same time. Whether 0.30 delta is actually the sweet spot for your specific names is something the formula can't settle for you. It's calibrated on what tends to work broadly. After a few cycles on a name, you'll have a view on whether your stocks respond differently.
Worked example (hypothetical)
Say you hold 100 shares of a healthcare company with a cost basis of $38.00 per share. The stock is trading around $40.00. The screener finds a $42.00 call, 30 days to expiry, with a mid-market premium of $1.60 per share ($160 per contract) and a delta of 0.29.
The arithmetic, verified against the scoring formulas in the code:
- pctAboveBasis: (42.00 minus 38.00) / 38.00 times 100 = 10.5%
- rocPct: (1.60 / 42.00) times 100 = 3.81% over the 30-day contract life
- rocPctAnnualized: 3.81 times (365 / 30) = 46.4%
- normalizeROC(46.4): min(46.4 times 2, 100) = 92.8
- deltaSweetSpot(0.29): distance from 0.30 is 0.01, penalty is 3.33 points, score = 96.7
- upsideScore(10.5%): distance from the 5% peak is 5.5%, score = max(0, 100 minus 55) = 45.0
- compositeScore: (0.40 times 92.8) + (0.40 times 96.7) + (0.20 times 45.0) = 37.1 + 38.7 + 9.0 = 84.8
- Grade A (84.8 is above 80)
If the stock closes above $42 at expiry, shares get called away at $42. The total gain per share: premium collected ($1.60) plus the gain from cost basis to strike ($42.00 minus $38.00 = $4.00) = $5.60 per share, $560 on the 100-share position. On a $3,800 cost basis that's 14.7% on the assignment scenario over 30 days.
If the stock stays flat or drifts below $42, the call expires worthless. You keep the $160 premium, the shares stay in your account, and your effective cost basis drops from $38.00 to $36.40 for the next cycle.
If the stock drops to $30 on bad news, the call expires worthless and the $160 is yours. The shares are down $800 from cost basis. Net position: minus $640.
Key point: Now drop an earnings date 12 days from now into that same setup, inside the 30-day expiry window. The screener immediately applies the earnings veto: score becomes zero, grade becomes F, and the earnings date appears as a flag on the row. All the scoring arithmetic above is irrelevant at that point. The veto fires first.
The earnings veto
When an upcoming earnings date falls between today and the expiry of the call being evaluated, the screener scores that recommendation zero and grades it F. Not a warning, an override. The grade changes regardless of what the three scoring components would have produced.
IV is elevated before earnings because the market is pricing uncertainty around the announcement. That makes the premium look higher than it would for the same strike on a normal cycle, which can make the screener's row look attractive when it actually reflects event risk rather than structural yield. The stock can gap 15 to 20% in either direction on a surprise. If it gaps down, you're holding shares well below basis. If it gaps up past the strike, you get called away and miss the move.
The screener surfaces earnings-flagged rows with the date visible. Pick strike still works; you can see all the candidates and decide. The F grade makes the veto visible, not irreversible.
The Re-scan button and scan budget
Re-scan forces a fresh run through your holdings list, chain pulls, scoring, and ranking. Use it when you've logged a new holding, closed a position, or want fresh pricing after a significant market move.
Chains are read across up to 3 expiries per ticker, spread evenly across the available expirations out to 45 days rather than just the nearest three. You get a representative sample of the expiry landscape (nearest, middle, furthest) without the scan creating problems for other page activity.
What to look for (and what to avoid)
- Grade A with DTE between 20 and 45 is the combination worth acting on. Theta decay is working in your favor, IV is still meaningful, and all three sub-scores are pulling the same direction.
- WHEEL source with no earnings flag is the cleanest setup available in the screener. The cost basis is exact, there's no staleness question, and the Wheel Tracker owns the complete P&L chain.
- A STALE flag on a JOURNAL lot stops the process. Verify you actually hold the shares before you do anything with that row. A covered call against shares you no longer own is a naked call.
- Delta between 0.25 and 0.35, pctAboveBasis between 3% and 8% is the zone where you're collecting real premium without writing a strike so close to spot that assignment is nearly certain.
- Grade C or below with DTE under 14 usually means the premium is being driven by something specific, not by ordinary options dynamics. Look at what's going on with that name before you sell.
- A position deeply underwater will produce a low-grade result or no recommendation at all. No strike above basis is generating meaningful premium. The screener is correct. The problem is the share position.
Try this: For a quick first filter, look for WHEEL source, no earnings flag, and delta in the 0.25 to 0.35 range. That combination means the cost basis is exact, there's no event risk baked into the premium, and the strike is in the zone where income potential and assignment probability are reasonably balanced.
Common mistakes
Writing calls below cost basis. When shares are down, the impulse is to collect something, anything. A strike below basis means assignment produces a net loss, and the premium doesn't bridge the gap.
Comparing annualized returns across wildly different DTE ranges. A Grade A at 14 DTE and a Grade A at 45 DTE both cleared 80 points, but they're built from different inputs. The 14-DTE Grade A likely has a higher annualized ROC driving most of the score. Compare within a similar DTE range when you're choosing between two recommendations. A 300% annualized figure on a 10-DTE call is telling you about the premium level right now, not about what you can systematically collect over the next year.
Treating the earnings veto as a hard stop. The F grade makes the exposure visible, not the trade impossible. If you've sized the position to handle a gap and have a specific reason to want the earnings cycle premium, Pick strike is available. Just don't read the elevated premium as normal systematic income.
Missing ex-dividend risk on deep ITM calls. The screener flags earnings, not ex-dividend dates. If a call is deep in the money going into an ex-div date on a name with a meaningful dividend, check the dividend calendar yourself before the date arrives.
How it pairs with the rest of the tools
The natural starting point for the wheel is the Cash Secured Puts screener. That screener finds cash-secured puts where the premium and risk parameters make sense for entering a position. When one of those puts gets assigned, you own the shares at the strike price, and that lot immediately appears in this screener as a WHEEL source with the exact cost basis.
The Wheel Tracker holds the complete cycle view. Every CC position you open from Pick strike shows up in the Active tab immediately. The tracker computes your wheeled basis (cost basis reduced by every premium collected across all prior cycles on that name), tracks the running P&L, and keeps the full history from CSP entry to final callaway or close.
Unusual Activity scores individual options prints for a specific ticker. If you're holding 200 shares of a name and you see a large put sweep on the Unusual Activity feed, that's context worth having before you sell a call against those shares. The covered calls screener grades the call from your holding data; Unusual Activity tells you what else is happening in the options market for that name right now.
Live Flow rolls up the $20k-plus options tape by ticker. A name showing heavy bearish premium on Live Flow while you're considering selling a call against it is worth looking at before you commit to capping your upside.
One thing worth being clear about: the screener won't alert you if a call goes deep in the money mid-cycle, and it doesn't know about positions in accounts your journal isn't tracking. Use "Already own shares? Start here" to register those. The roll decision, the assignment decision, the timing call on a live position: all yours.
Options trading involves real risk, including potential loss of the full value of your shares. A covered call limits your upside but does not protect against downside. A stale holding flag is a prompt to verify you still own the position before acting. An earnings flag means the premium reflects event risk, not a structural wheel income opportunity. Nothing in this article is investment advice; it describes how the tool works and what the numbers mean. Verify all strikes and premiums against live quotes before opening any position.