Options Screeners deep dive · 16 min read
How to use the Cash Secured Puts screener
A full walkthrough of the Cash Secured Puts screener: how the EdgeScore is computed, what each column actually measures, and how to avoid the mistakes that turn a decent income strategy into a bad holding.
Open the tool →Hey guys, Art from TraderMatrix here. The Cash Secured Puts screener is deeper than it looks, and I want to give it the walkthrough it deserves. We'll cover what a cash-secured put actually is, tour every panel and column, walk through the real October 1, 2026 data, and get into the mistakes that turn a decent income strategy into a bad holding.
The short version:
- The screener ranks candidates by EdgeScore, not by raw premium or weekly yield.
- IV above 120% triggers a binary-event penalty that cuts the score sharply.
- Weekly ROC is capped at 2.5% in scoring; yield above that earns no extra points.
- Only sell puts on stocks you'd genuinely want to own, because assignment happens regularly.
- Delta near -0.20 is the sweet spot: enough premium, low enough assignment probability.
What a cash-secured put actually is
A put option gives its buyer the right to sell 100 shares of a stock at a specific price (the strike) before a specific date. When you sell that put, you collect cash today in exchange for promising to buy those 100 shares at the strike if the buyer exercises the contract.
Cash-secured means you have the full amount on hand to honor that promise. If you sell a $14 put on CIFR, you need $1,400 set aside. That cash is collateral. Not borrowed against, held as a genuine backstop.
Two outcomes happen regularly, and the whole point is being okay with both.
The first: the stock stays above your strike at expiration. The put expires worthless, you keep the premium, and your cash is free again. You run the same trade next week.
The second: the stock drops below your strike. You get assigned. You now own 100 shares at the strike price, minus the premium you already collected. That reduced price is your real cost basis. If you've been selling puts on the same name for a few cycles before assignment, that basis can be well below where the stock was trading when you started.
This framework is called the wheel. After assignment, you sell covered calls against the shares you now own, collecting more premium while you wait for the stock to recover or get called away above your cost basis. The Cash Secured Puts screener is the first leg of that cycle.
The one condition that separates safe from catastrophic is the one every experienced wheel trader repeats: only sell puts on stocks you'd genuinely want to own for a year. Not "it's probably fine." Actually want to own. Because the second outcome isn't theoretical. It happens regularly, usually on the name that dropped 15% the week after you sold the put. If you sold purely for yield on something you don't believe in, you now own shares in a downtrend with your capital locked up.
Watch out: The screener can rank puts by quality, but it cannot tell you whether you'd be comfortable holding the shares at the strike. Selling puts on names you don't believe in just for the yield is exactly how the wheel turns into a bad holding.
What makes premium high, and why that's not always good
The implied volatility (IV) of an option determines most of its premium. High IV means expensive options.
Premium sellers benefit from high IV because they collect more. But high IV also means the market expects a large price move. A put with 100% IV is priced to cover a scenario where the stock drops hard before expiration. The premium looks generous because something is expected to happen. That could be an earnings report, a regulatory decision, a trial result, or just a name that moves violently all the time.
Key point: The screener rewards IV up to 120%, then cuts the Premium Quality component in half above that threshold. A put with 140% IV is not automatically better than one with 85% IV. When IV is that extreme, the market is pricing a binary event, and the score treats it that way.
The page, top to bottom
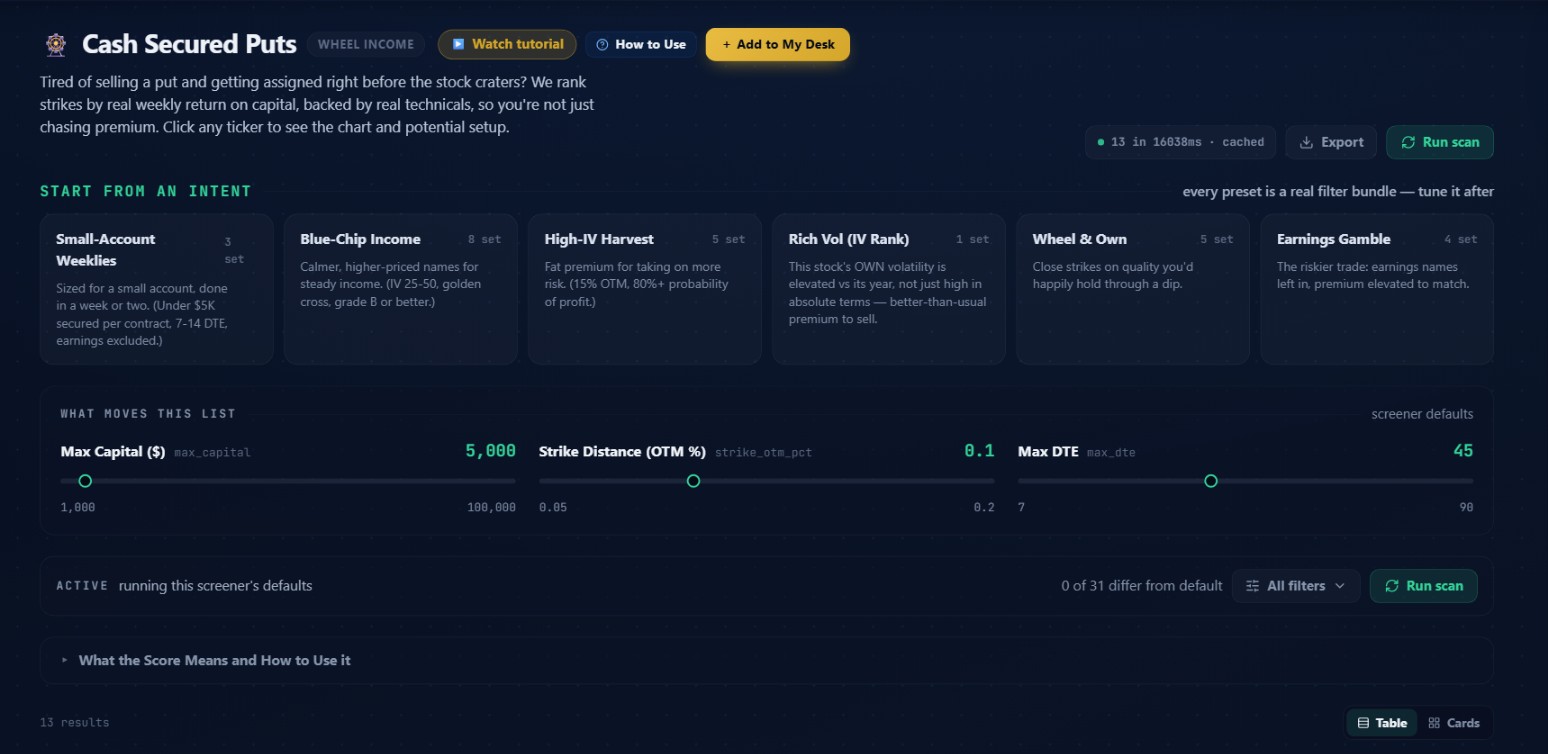 The page after the October 1, 2026 close. Six intent presets across the top, three key sliders, and 13 results already ranked by EdgeScore. CIFR at the top: $14 strike, $44 premium per contract, 1.45% weekly return on capital.
The header
At the top: "Cash Secured Puts" with a green "WHEEL INCOME" tag. Three buttons: Watch Tutorial, How to Use (opens a side panel), and Add to My Desk. The blurb reads: "Tired of selling a put and getting assigned right before the stock craters? We rank strikes by real weekly return on capital, backed by real technicals, so you're not just chasing premium."
That's the actual design logic. The screener doesn't sort by raw premium. It ranks by an EdgeScore that weighs technical setup, liquidity, and return efficiency. A name with 4% weekly ROC and a D grade doesn't beat a name with 1.4% weekly ROC and an A grade.
The intent presets
Six gray cards below the description, each saying how many filters it sets.
- Small-Account Weeklies (3 set): names under $5,000 secured per contract, 7 to 14 DTE, earnings excluded. Short duration, small capital, zero earnings exposure.
- Blue-Chip Income (8 set): adds the golden cross requirement (50-day moving average above the 200-day), limits IV to the 25-50 range, and requires grade B or better. Calmer names with a long-term bullish trend filter behind them.
- High-IV Harvest (5 set): sets the strike 15% OTM and requires 80% or higher probability of profit. More cushion on premium-rich names.
- Rich Vol / IV Rank (1 set): turns on the IV Rank filter. IV Rank measures where the stock's current volatility sits relative to its own 52-week history, on a 0-to-100 scale. A rank of 70 means the stock is in the top 30% of its own volatility year. For a put seller, that matters more than absolute IV.
- Wheel & Own (5 set): focuses on close strikes and names you'd actually be comfortable holding. "Close strikes on quality you'd happily hold through a dip."
- Earnings Gamble (4 set): flips the default. Instead of excluding earnings names, it keeps them in with a flag in the Earnings column. Highest-risk preset on the page.
Clicking any preset loads those filters and immediately re-runs the scan. Every preset is a real filter bundle; tune it after.
The three key sliders
Below the presets, a section labeled "WHAT MOVES THIS LIST" with three sliders.
Max Capital defaults to $5,000. This is the maximum cash you're willing to set aside per contract. Since each contract represents 100 shares, a $5,000 cap means the screener only considers strikes at or below $50. The price ceiling is derived directly from this slider: max capital divided by 100.
Strike Distance (OTM %) defaults to 0.1, meaning 10% out of the money. The screener finds the put strike closest to 90% of the current stock price. Tighten it to 0.05 and you're targeting strikes closer to the stock's price, more premium but less cushion. Push it to 0.2 and you find deeper strikes with higher probability of profit but lower weekly ROC.
Max DTE defaults to 45, minimum 7. The scoring formula normalizes everything to a per-week basis, so a 14-DTE put at 1.4% weekly ROC and a 45-DTE put at 1.4% weekly ROC are genuinely comparable on this screener. Short expirations produce structurally higher ROC numbers by construction, which matters when you're interpreting the ROC column.
The filter chip bar
Below the sliders: "ACTIVE: running this screener's defaults" with "0 of 31 differ from default" on the right. The All Filters button expands the full panel. Run Scan re-runs with your current settings.
The 31 filters, grouped by area:
- Stock and capital: price range, max capital, minimum volume
- Technicals: ADX ceiling, RSI band, golden cross toggle, EMA/ATR proximity toggle, weekly-only toggle
- Volatility: minimum monthly volatility, minimum IV, maximum IV, minimum IV Rank, maximum IV Rank
- Return thresholds: minimum weekly ROC, minimum profit probability, minimum premium in dollars, minimum premium as a percentage of spot
- Strike and expiry: strike OTM percentage, minimum DTE, maximum DTE
- Liquidity: minimum option volume, minimum open interest
- Earnings: earnings exclusion toggle, flagged-earnings toggle, earnings days buffer
- Display: minimum grade, sort order, results count, single-ticker mode
The score explainer
"What the Score Means and How to Use it" collapses by default. Worth expanding once before you start using the table.
The EdgeScore: how it actually works
The score is a weighted composite of four factors plus a bonus.
Premium Quality (40%). Uses the put's implied volatility. IV between 25% and 80% scores on a linear scale, hitting 100 at 80% IV. Above 80% it stays at 100 until it crosses 120%. At that point it drops to 50, cutting this component's contribution in half. The code calls this a binary-event penalty. When IV is that extreme, the market is pricing a move that a normal premium-selling thesis doesn't account for.
ROC Efficiency (25%). Weekly return on capital, normalized. The formula scales ROC from 0 to 100 where 2.5% weekly is the ceiling. A 1% weekly ROC scores 40. A 2.5% weekly ROC scores 100. A 4.39% weekly ROC also scores 100, because the formula caps there. Yield above 2.5% per week doesn't improve the score.
Technical Setup (20%). Based on RSI and ADX. RSI between 40 and 60 earns full marks (100 points). RSI 30-40 or 60-70 gets partial credit (60 or 70 respectively). RSI outside those ranges scores only 20. ADX adds a penalty on top: (ADX minus 20) divided by 15, times 30. At ADX 35, that's the maximum 30-point penalty. A technically perfect RSI of 50 with ADX at 35 nets a technical score of 70, not 100. Any strong trend, up or down, is a problem for a put seller who needs the stock to stay roughly where it is.
Liquidity Quality (15%). Two inputs: open interest on the selected put (up to 500 contracts maps linearly, contributing up to 40 points) and quote quality. The screener classifies each quote as firm (bid/ask spread under 30% of the mid), wide (above 30% with both sides present), or indicative (bid collapsed, priced off a last trade). Quote quality is a multiplier on the OI score. The hard minimum is 25 contracts OI. Below that floor, the put is excluded.
Support Floor Bonus (0 to 10 points). When there's significant put open interest at strikes within 5% below your target, market makers short those puts need to buy stock as price approaches. That creates buying pressure near your breakeven. The bonus scales linearly: 5,000 or more nearby put OI contracts earns the full +10.
Key point: The ADX penalty matters most on trend-following names. Bitcoin-correlated miners like MARA often score lower on technicals than their IV and ROC would suggest, because any strong trend, up or down, is exactly what the technical component penalizes.
After computing the raw score, the screener applies structural adjustments for the displayed letter grade. These look at delta proximity to 0.20, put-wall support, IV richness relative to the stock's own recent history, expected move, and max pain. The adjustment can shift the grade up or down by up to two letter bands. It only affects the letter, not the numeric score used for sorting.
| Grade | Score threshold |
|---|---|
| A | 92 or above |
| B | 80 to 91 |
| C | 65 to 79 |
| D | 50 to 64 |
| F | Below 50 |
The results table
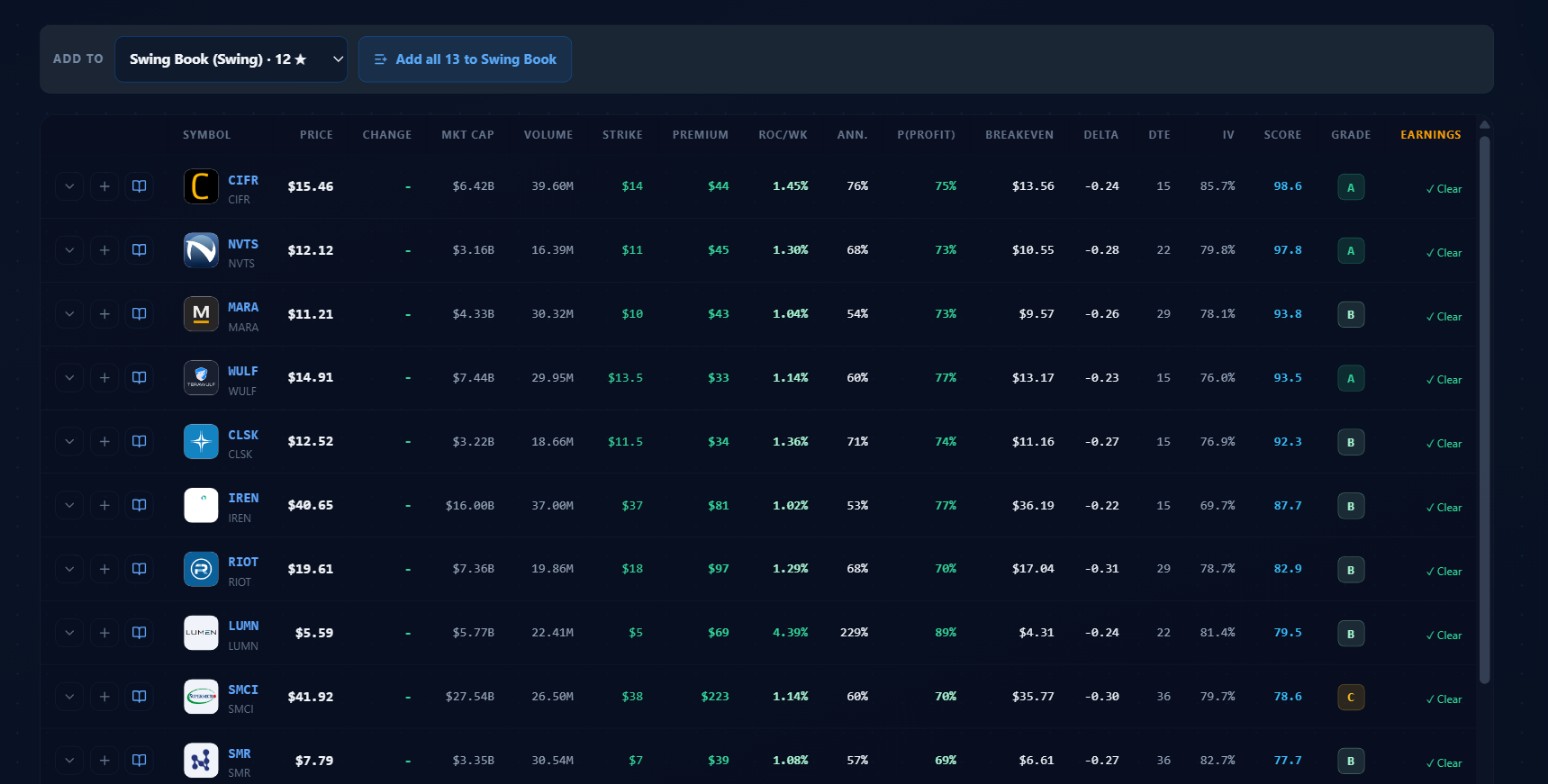 October 1, 2026 after the close. 13 results total, 10 visible. LUMN (row 8) shows 4.39% weekly ROC and 229% annualized at grade B. SMCI at grade C.
Every column, in order:
- SYMBOL: ticker with a small logo. Click to open the chart and setup details.
- PRICE: underlying stock price when the scan ran.
- CHANGE: daily percentage move. Not part of scoring, useful for context.
- MKT CAP: market cap. Defaults filter for common stock on NASDAQ, NYSE, and AMEX, so results tend toward mid-cap and larger.
- VOLUME: shares traded that session.
- STRIKE: the put the screener selected. Targets 10% below current price at defaults, then picks the nearest listed strike subject to the capital constraint. For CIFR at $15.46, the target is $13.91 and the nearest listed strike is $14.
- PREMIUM: per-contract premium in dollars (per 100 shares). CIFR shows $44, or $0.44 per share. Uses the mid of bid and ask for a firm quote, or last traded price when the quote has a collapsed bid.
- ROC/WK: return on capital per week. (Premium per share divided by strike price) times 100, divided by (DTE divided by 7). CIFR: 1.45% per week.
- ANN: annualized return, assuming re-entry at the same yield every cycle. Theoretical; most useful for comparing across different DTE windows.
- P(PROFIT): probability the put finishes above breakeven at expiration, using a lognormal price model with zero drift. CIFR: roughly 75%.
- BREAKEVEN: strike minus premium per share. CIFR: $14.00 minus $0.44 equals $13.56, about 12% below the current stock price of $15.46.
- DELTA: the put's delta, negative. CIFR shows -0.24. Around -0.20 is where most wheel traders aim.
- DTE: days to expiration.
- IV: implied volatility on the selected put. CIFR shows 85.7%.
- SCORE: raw EdgeScore before structural adjustments.
- GRADE: letter grade after structural adjustments.
- EARNINGS: a green "Clear" check when the next earnings date falls outside the selected expiration.
Try this: Before acting on any row, put the breakeven level on a chart and check whether there's prior price structure, a moving average, or a put wall from the Gamma Scan near that price. Breakeven at a real support level is a different position than breakeven in open air.
Walking through the October 1 data
The screener returned 13 results at default settings on October 1, 2026 after the close.
CIFR at $15.46 is the clearest example of what the screener looks for. Strike $14, 15 DTE, $44 premium, 1.45% weekly ROC, 75% probability of profit, delta -0.24, score 98.6, grade A. IV of 85.7% earns strong premium quality marks without triggering the 120% penalty. Weekly ROC is above the 1% minimum but below the 2.5% ceiling where the ROC score stops climbing. Delta sits inside the -0.15 to -0.25 zone. Earnings clear. Everything aligns.
NVTS at $12.12 (score 97.8, grade A) and WULF at $14.91 (score 93.5, grade A) are similar in character. WULF carries a slightly wider cushion from its lower delta of -0.23.
MARA at $11.21, $10 strike, 29 DTE, premium $43. ROC/WK 1.04%, score 93.8, grade B. Solid in absolute terms. The grade dropped because MARA's ADX is elevated, which triggers the technical penalty. Bitcoin-correlated mining stocks trend hard. That directional momentum is exactly what the score penalizes.
Then there's row 8. LUMN at $5.59: $5 strike, 22 DTE, premium $69. ROC/WK 4.39%, annualized 229%, P(Profit) 89%, score 79.5, grade B. The 4.39% weekly ROC is nearly three times CIFR's. The score is 79.5.
The ROC efficiency component caps at 2.5% weekly, so every bit of LUMN's yield above that threshold earns nothing in the score. Premium quality on 81.4% IV scores strong but not maxed. The drag is almost certainly technical: LUMN is a telecom with a complicated business situation, likely elevated ADX, and the structural adjustment probably pushed the grade toward B.
The 89% probability of profit and -0.24 delta are actually better than most rows on the screen. The breakeven of $4.31 sits 23% below current price. On paper, the math looks fine. The question the screener can't answer is whether you'd actually want to own LUMN shares if assignment happens.
Watch out: A high P(Profit) and a wide breakeven cushion are comforting numbers right up until the put expires in the money. If you wouldn't hold the shares, the yield is not worth the position.
SMCI at $41.92: $38 strike, 36 DTE, $223 premium per contract. Biggest absolute premium on the screen by a wide margin. ROC/WK 1.14%, score 78.6, grade C. SMCI has had significant accounting and governance concerns. Its IV of 79.7% is within normal range, but the technical setup and structural adjustments pushed the grade to C. Grade C is a skip unless you already have conviction in the name.
How it pairs with the other tools
Gamma Scan shows put walls: the strikes where large open interest concentrations mean dealers have short gamma and need to buy stock as price approaches. If your CSP strike sits near a put wall, you have a support floor at or near your breakeven. The screener's support floor bonus captures a version of this in the score, but Gamma Scan gives you the actual chain-level OI distribution by strike.
Earnings Calendar is the veto. Check it for every name you're serious about, regardless of what the Earnings column shows. Worth it especially when you're considering a name in the 20-35 DTE range.
After assignment, the Wheel Tracker maintains your true cost basis across multiple cycles. The effective cost basis after four cycles of collected premium is materially different from the assignment price alone. The math across multiple names gets unmanageable without tracking it.
For broader context before running the screener, Sector Flow shows where institutional options flow is concentrating by sector. Selling puts into a sector with heavy bearish institutional flow is a different trade than selling into one with neutral or accumulating flow.
Before you trade
The screener ranks candidates. A chart look is still required.
Put the breakeven level on a chart. CIFR's $13.56: is there prior price structure, a moving average, or a put wall from Gamma Scan near that price? Breakeven at a real support level is a fundamentally different position than breakeven in open air.
Check earnings independently, even when the column shows Clear. The default 14-day buffer means a report 16 days out with a 20 DTE put won't be excluded. That put expires right through the report. Earnings Calendar shows exactly where the next report lands relative to any expiration you're considering.
Read delta and P(Profit) as two independent estimates of the same thing. A -0.31 delta on RIOT means roughly 31% probability of assignment. A 70% probability of profit means roughly 30% chance you finish below breakeven. Those numbers rhyme. When they diverge significantly, it's usually because IV or DTE was missing and the probability calculation fell back to the delta proxy.
Mistakes worth knowing about
Sorting by ROC and taking the top row is the most common one. The ROC column is one of four inputs to the score. The screener sorts by EdgeScore by default. The top ROC row and the top-scored row are usually different names. LUMN's 4.39% weekly is eye-catching. IREN's 1.02% with a -0.22 delta, 69.7% IV, grade B, and breakeven 11% below spot is a cleaner setup on every dimension except the yield column.
Panic-rolling when a position moves against you. Rolling down and out to avoid assignment extends your duration and adds delta to a losing position. Do it a few times and your income trade has become your largest holding, underwater. The wheel only works if assignment is acceptable. Take it, update your basis, sell calls.
Holding to expiry for the last nickel. A put you sold for $0.44 that's now worth $0.05 has returned 89% of its max value. Holding four more days for five cents means carrying full assignment risk for almost nothing. Most wheel traders buy to close at 80-85% of max profit and redeploy the capital.
Watch out: The loss scenario that's easy to skip: you collect $44 per contract and take on $1,400 of downside. A 40% gap below your breakeven on assignment leaves you holding shares at a serious paper loss, with covered calls that pay little because IV collapsed with the price. Position sizing is the actual answer: no single name at more than 20% of your wheel capital is a reasonable starting point.
One more, definitional: cash-secured means the cash actually has to be there. Using margin to back a put makes it a naked put, with a margin call when the stock drops. Completely different risk profile, completely different discussion.
This is for educational purposes only. Selling cash-secured puts carries the full downside risk of owning the underlying shares, from the strike price down to zero, partially offset by the premium collected. Nothing here is a recommendation to buy, sell, or hold any security. Trading involves risk of loss.