Loading...

Signal Scanners deep dive · 17 min read
How to read the Day Trading Watch List
A top-to-bottom walkthrough of the Day Trading Watch List: how all five filters work, what float rotation and RVOL actually measure, how the catalyst classifier separates real news from roundups, and how to build a morning routine around the frozen 9:28 AM snapshot.
Open the tool →Hey guys, Art from TraderMatrix here. If you trade morning gaps, this page is probably the one you'll use most. Let me walk through it, because every number is computed a specific way and knowing that is the difference between reading it and actually using it.
The short version:
- The page scans morning gappers against five filters and freezes at 9:28 AM ET so you have one fixed list to work from all session.
- Names are ranked by float rotation, not by gap percentage. Rotation measures how many times the available supply changed hands premarket.
- The catalyst tag is VERIFIED (primary-source event naming this ticker), ROUNDUP (written about the gap, not causing it), or NONE. Read it before the gap percentage.
- Near Misses shows names that almost cleared, sorted by how close they came to the blocking threshold, not alphabetically.
- NO OPTIONS on a chip means no options chain exists for that name.
What a premarket gap is and why most don't matter
A premarket gap is when a stock's price opens meaningfully different from where it closed the prior session. You see it constantly in small-cap: a name closes at $4 and opens premarket at $8. That's a 100% gap.
Most of them are noise. Some are on genuine catalysts, earnings beats, FDA approvals, contract wins. But plenty of gaps happen because a thin stock with 500K float gets one decent-sized premarket print and the bid jumps, with no news, no catalyst, just noise finding a low-float vehicle.
A gap on real news has at least some chance of continuation into the session. A gap on nothing, on a name trading 3,000 shares premarket, has sellers waiting at the open with nothing underneath. They fade before anyone gets in cleanly.
What makes small-cap gaps specifically worth watching is the float constraint. A large-cap stock at $180 gapping to $190 premarket has hundreds of millions of shares available. Sellers can absorb buyers without the price needing to move much. A 600K float stock gapping on real activity has almost no supply cushion. That's the reason this page caps float at 100 million shares: above that, the supply mechanics are fundamentally different.
The 10% minimum gap threshold isn't arbitrary either. Below that level you're looking at stocks inside the normal daily noise range for small-cap names. A 5% move can show up from late prints in the prior session without any real premarket event. 10% is where the gap starts signaling something actually happened overnight.
This page is trying to identify which gaps in that universe are worth watching. The output is a shortlist with catalyst info attached: here are the names that met five specific conditions, and here's what we know about whether any of them have a real reason for the move.
Why the snapshot freezes at 9:28 AM ET
Premarket data moves. A name can show up in a gap scanner at 7 AM with a 40% gap and 20,000 premarket shares. By 9:25 it has 800,000 shares and the gap has tightened to 22% because the opening bell sellers are already positioning. The entire setup has changed.
If you're running the page while the bell is ringing and looking at a number that updated 30 seconds ago, you're chasing a moving target.
Two minutes before the bell, at 9:28 AM ET, the page publishes its final snapshot and stops updating. What you see is what you had at the open, captured in time. After the close it shows as SETTLED, with the note that the session is over and the next list opens at 4:00 AM ET the following trading day.
One fixed list to work from all morning. When you come back at 10:30 to check how names resolved, you're comparing against the same data you had at the bell.
Key point: The 9:28 freeze means every catalyst read and float rotation comparison all morning happens against the same premarket snapshot. The list does not update after the freeze.
Reading the session rail
The timeline strip at the top shows where in the session you are. Three labels: 4:00 SCAN OPENS on the left, 9:28 FREEZE in the middle, 16:00 CLOSE on the right. A fill bar shows progress.
Before 9:28 the pill shows SCANNING, meaning the list is still live and names can enter or leave. At 9:28 it switches to FROZEN: the list is published and won't change. After 4:00 PM the pill shows SETTLED and the note reads "Closed, next scan 4:00 AM ET." That's what the page looks like on October 1.
On the right side of the header is the scan summary tile. October 1 showed 8 scanned, 5 names cleared all five. The three that didn't clear appear below in Near Misses.
Below the title is a FILTERS line. October 1 read: gap >= 10%, $1-$100, float <= 100.0M, premkt vol >= 50K, rvol >= 0.25x. These are the live filter values the scan ran with, pulled from the stored snapshot.
The five filters
The scan checks every morning gapper against five conditions. Four are hard gates. One is soft.
Gap >= 10% (hard)
Gap is measured against yesterday's regular-session close, not the premarket open. That's more precise than the "premarket change" field you see in most chart tools, which often anchor off a different reference price and under-report the move. A stock that closed at $4.28 and is trading at $8.79 premarket has gapped 105.4%, not whatever a chart vendor's premarket percentage says.
Hard means: fail it and you're dropped from the scan entirely. You won't appear anywhere on the page.
Price $1-$100 (hard)
Below a dollar, the bid-ask spread eats your potential profit before the trade has a chance to work. The spread on a $0.40 stock might be $0.04, which is already 10% of the price. Above $100, the share count you can reasonably carry gets small enough that the risk/reward stops making sense for most day traders.
Float <= 100.0M shares (hard)
Float is the number of shares available to trade. Smaller float means less supply, which means buyers can move the price faster. The screen caps at 100 million shares.
If the data has no float on file for a name, usually a fresh listing, the row is kept and flagged as unknown rather than silently dropped. The page shows "unknown" in the float gauge on those rows. You're getting a transparent flag that says the float is unconfirmed.
Premkt vol >= 50K shares (hard)
An absolute floor, not a ratio. On a name that trades 10,000 shares on a typical day, even a few thousand premarket shares can print an enormous relative volume ratio. The floor keeps genuinely dormant names from squeezing through on thin prints.
RVOL >= 0.25x (soft)
Failing only RVOL doesn't drop the row. It sends the row to Near Misses with a flag. That design is intentional and matters for how you read the near miss table, which I'll cover below.
RVOL here is premarket volume divided by the 10-day average daily volume. It is not a regular-session relative volume figure, which would be meaningless before the bell. The page computes it from two fields: extended-hours volume and the 10-day average. A reading of 1.0 means a full normal day's worth of shares has already traded before the open. NXL's 686x on October 1 means 686 full trading days' worth of volume moved premarket.
Key point: RVOL here is premarket-only. NXL at 686x and VEEA at 10.4x each say something about their own histories. They are not directly comparable across stocks, which is why float rotation anchors the ranking instead.
The lead card in depth: NXL on October 1, 2026
The first row that cleared all five on October 1 was $NXL, a health technology name.
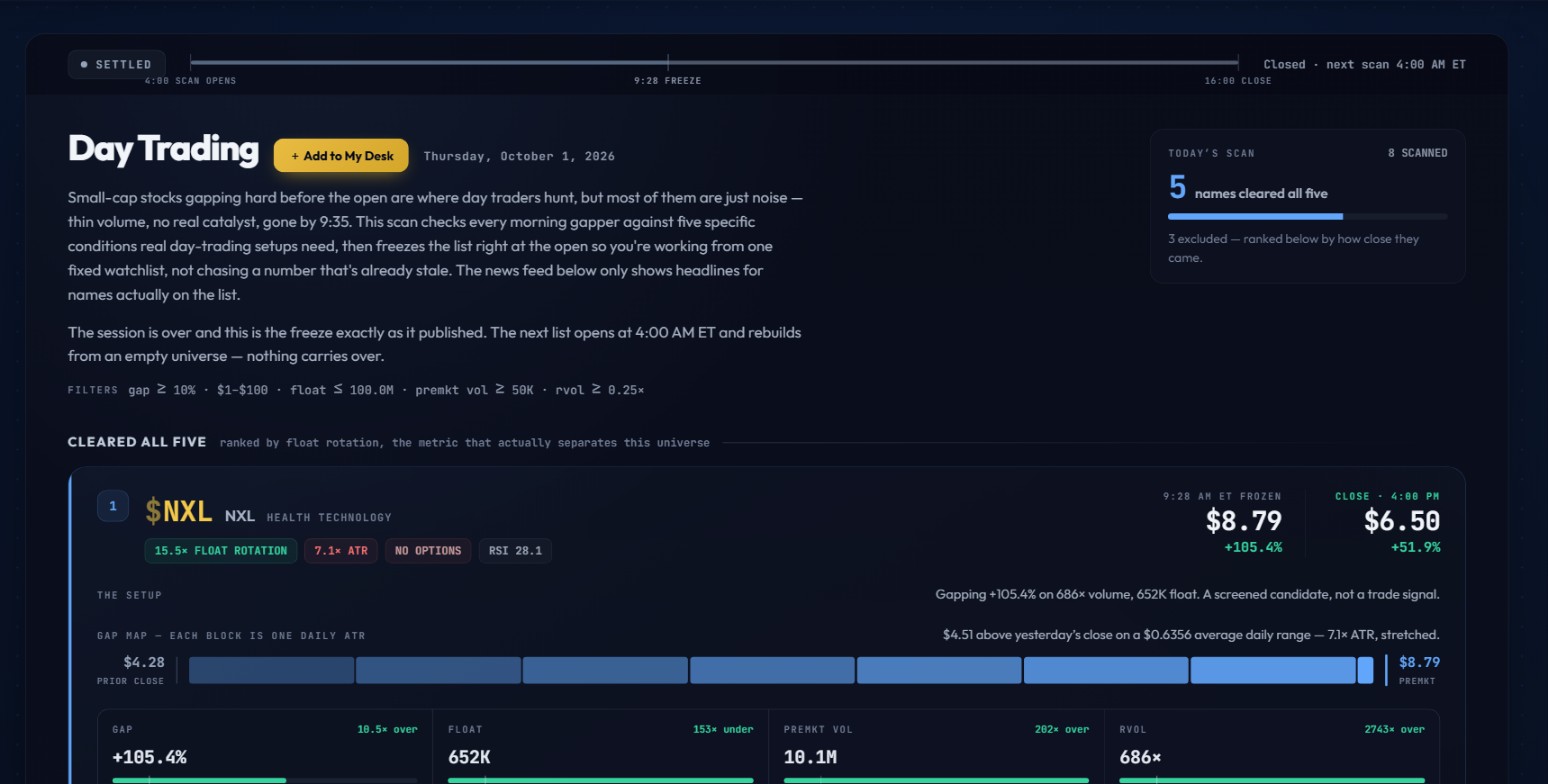 October 1, 2026 session after the close. SETTLED, 5 names cleared all five, 3 excluded. NXL ranked #1 with 15.5x float rotation.
At the top of the card: $NXL, NXL, HEALTH TECHNOLOGY. A link to Ticker Search for this symbol. The chips: 15.5x FLOAT ROTATION, 7.1x ATR, NO OPTIONS, RSI 28.1.
On the right side of the header: the frozen 9:28 price at $8.79 (up +105.4%), and the close at $6.50 (up +51.9% from prior close). The close is shown in the settled view so you can see how the name behaved after the freeze.
Under THE SETUP: "Gapping +105.4% on 686x volume, 652K float. A screened candidate, not a trade signal."
686x volume on a 652K float. More than 686 full trading days' worth of NXL shares had traded before the open. I've watched names with this exact profile run to double the premarket price, and I've watched the same setup fade straight back to the prior close by 10 AM. The data tells you the activity was real. It doesn't tell you what happens next.
The gap map
Below the setup line is the GAP MAP. The note reads "EACH BLOCK IS ONE DAILY ATR." For NXL on October 1: "$4.51 above yesterday's close on a $0.6356 average daily range, 7.1x ATR, stretched."
Each block in the bar is one average true range for NXL. Prior close on the left at $4.28, premarket price on the right at $8.79. Seven-plus blocks span the gap, 7.1 times the stock's typical daily range.
The code uses three labels: "stretched" at 3.0 ATR or higher, "extended" for 1.5 and above, "inside a normal day" below 1.5. The ATR multiple matters because it scales the gap against the stock's own volatility history, not just a raw percentage. A 40% gap on a stock that moves 5% per day is different from a 40% gap on one that moves 30% per day on a normal session. NXL at 7.1x cleared both bars.
The blocks fade left to right: progressively higher moves from the prior close are progressively more unusual for this specific name.
The clearance gauges
Below the gap map are four gauges, one per measurable filter: GAP, FLOAT, PREMKT VOL, and RVOL. Each shows the actual value, margin of clearance, a bar on a log scale, and the threshold.
For NXL on October 1:
- GAP: +105.4%, 10.5+ over the 10% floor
- FLOAT: 652K, 153+ under the 100M cap
- PREMKT VOL: 10.1M, 202+ over the 50K floor
- RVOL: 686x, 2743+ over the 0.25x floor
The bar is log-scaled. A name that barely scraped through shows a thin bar near the start. NXL's bars are full because all four readings sit so far above the threshold that even on a log scale the distance collapses.
The float gauge says "153+ under" because you want to be under the cap, and 652K is 153 times smaller than 100M. At exactly the 100M cap the bar would read 1x. NXL at 652K reads 153x, full bar.
Catalyst classification
Every row on this page has a catalyst box. Three possible states, and this is probably the most practically useful part of the page.
VERIFIED: A headline was found, it's not a roundup article, and it specifically names this ticker or company. VEEA on October 1 showed a VERIFIED badge with the headline "Veea Announces Agreement With TROLLEE Holdings For Phased Deployment Of VeeaONE Solutions Across 1,000 Unattended Stores." A primary-source event, attributed to VEEA by name. You can read that as the reason the stock moved.
ROUNDUP (the roundup tag): A headline exists, but it's an auto-generated article of the "stocks moving premarket" type. These articles are written about the gap, not about an underlying event. They exist because the gap happened. NXL, MEDS, SDEV, and LPA all showed the roundup tag on October 1. The explanation reads: "The only story on the wire is an auto-generated roundup, a consequence of the gap, not a cause. It is not sold here as a catalyst. Trade this as a pure technical gap."
NONE: No headline in the prior 24 hours. The page says: "No SEC filing, press release, or primary source found in the 24h window. The move itself may be the event, shorts covering or low-float ignition. Trade the tape, not an assumed fundamental."
Watch out: Most data providers attach all tickers mentioned in any news article. A roundup saying "health technology stocks are moving including NXL" gets NXL tagged as having news by those systems. This page checks whether the article specifically names this ticker as the subject.
The classifier closes a gap most scanners leave open. Most data providers attach all mentioned tickers to a news article, so if a roundup says "health technology stocks are moving including NXL," NXL gets tagged as having news. The platform's classifier checks two things: is this a roundup-format headline, and does it specifically mention this ticker or company name? Fail either check and it's classified as roundup, never verified.
The compact rows for names 2 through 5
Rows two through five use a more compact layout: ticker, sector, price, gap percentage, a mini gap bar with ATR multiple, float rotation, RVOL, and the catalyst tag.
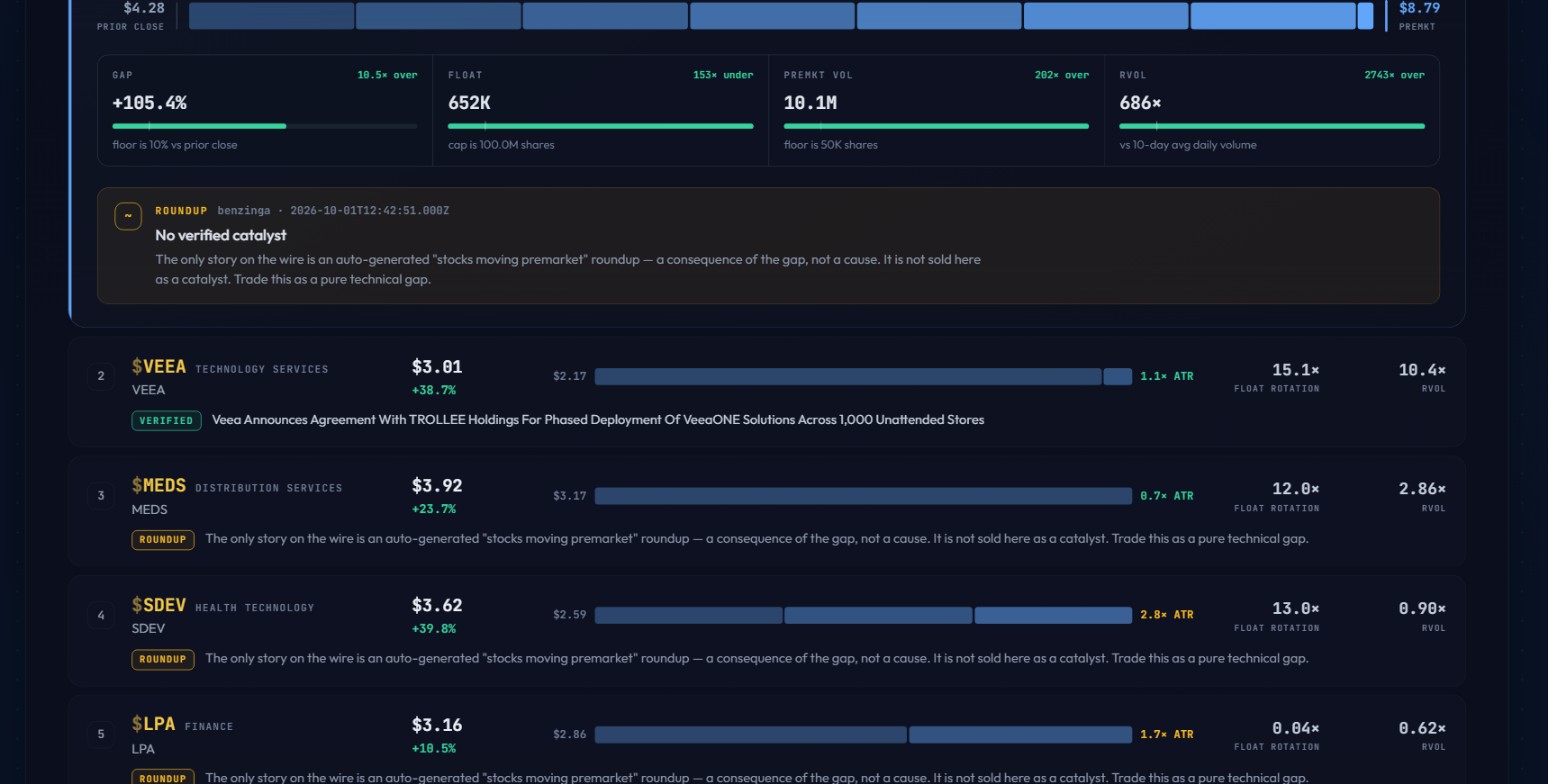 Rows 2 through 5, showing gap bar, ATR multiple, float rotation, RVOL, and catalyst tag for each name.
October 1 breakdown:
| Ticker | Sector | Gap | ATR | Float Rot | RVOL | Catalyst |
|---|---|---|---|---|---|---|
| VEEA | Technology Services | +38.7% | 1.1x | 15.1x | 10.4x | VERIFIED |
| MEDS | Distribution Services | +23.7% | 0.7x | 12.0x | 2.86x | ROUNDUP |
| SDEV | Health Technology | +39.8% | 2.8x | 13.0x | 0.90x | ROUNDUP |
| LPA | Finance | +10.5% | 1.7x | 0.04x | 0.62x | ROUNDUP |
VEEA at 15.1x float rotation is almost tied with NXL for the top slot and is the only VERIFIED catalyst name in this group. MEDS at 0.7x ATR: this gap moved less than MEDS does on an ordinary volatile day. LPA at 0.62x RVOL is the lowest in the cleared section, just above the 0.25x floor.
The Near Misses table
Below the cleared names is Near Misses. October 1 showed 3 of 3. The subtitle: "Sorted by how close they came to clearing, not alphabetically. The bar is the distance to the one filter that blocked them. A name at 84% is one more print away from the list, a name at 44% is not."
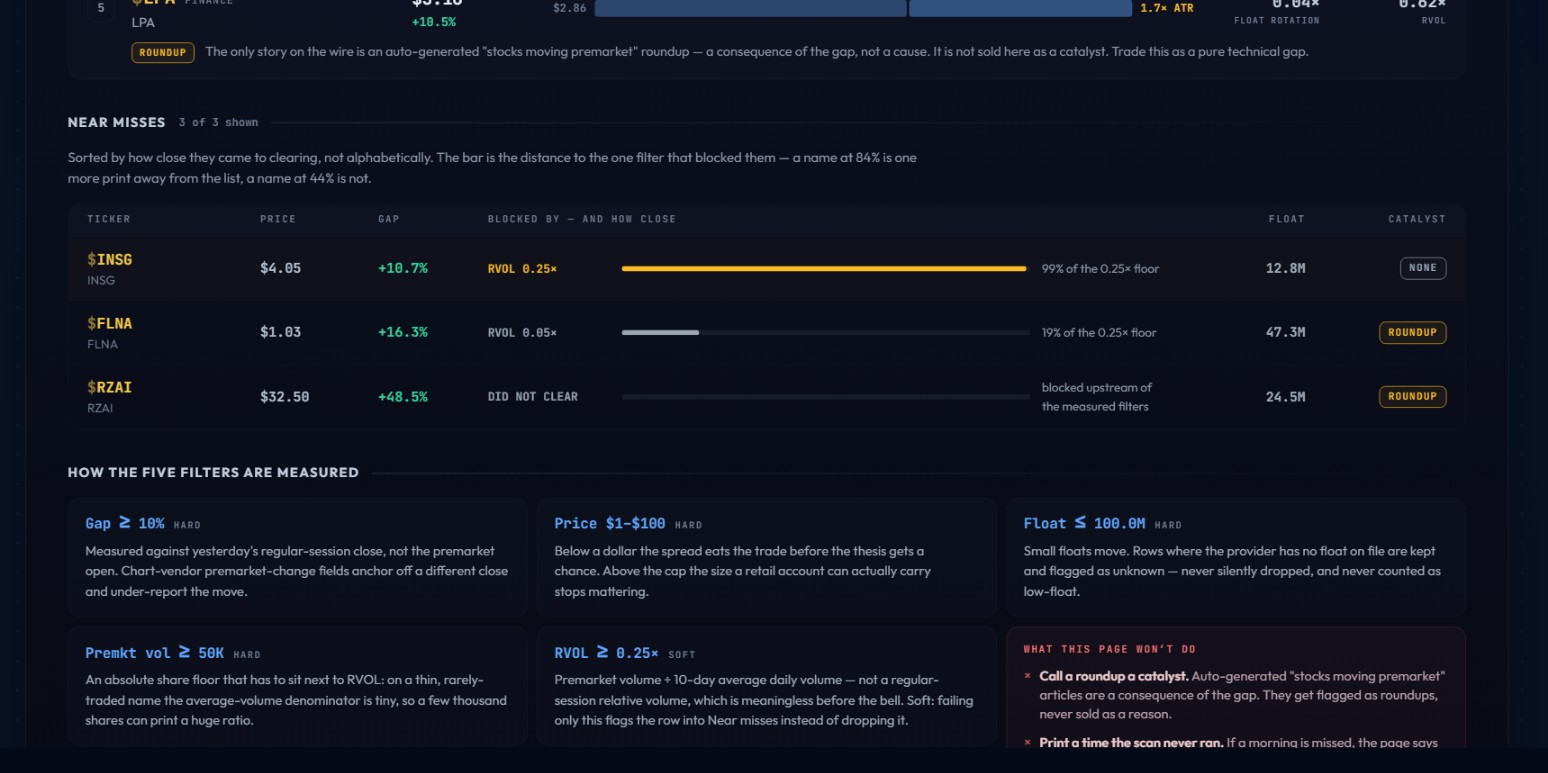 Near misses sorted by closeness. INSG at 99% of the RVOL floor is almost on the list. FLNA at 19% is not. RZAI is a different kind of miss entirely.
INSG: $4.05, +10.7%, blocked by RVOL 0.25x, at 99% of the floor. One more print and it would have been on the list. The volume was borderline, not absent.
FLNA: $1.03, +16.3%, blocked by RVOL 0.05x, 19% of the way to the threshold. Much further from clearing. The gap exists but the volume is thin.
RZAI: $32.50, +48.5%, DID NOT CLEAR, blocked upstream of the measured filters. RZAI has a 24.5M float and a roundup tag, but something in the pipeline blocked it before the five numbered criteria ran. The page says so directly rather than inventing a filter explanation.
Watch out: INSG at 99% of the RVOL floor and FLNA at 19% look similar in a table row, but they're different situations. INSG was borderline; FLNA was far from clearing. The bar percentage is the number to read.
RVOL blocking is a timing question: a name at 94% of the RVOL floor early in the session might clear as premarket trading deepens. Float blocking doesn't work that way.
Below the near miss rows the page shows a "HOW THE FIVE FILTERS ARE MEASURED" grid labeling each filter HARD or SOFT, and a "WHAT THIS PAGE WON'T DO" box with three items: call a roundup a catalyst, print a time the scan never ran, recommend anything. The LIVE NOW panel is below that. During a settled session like October 1 it shows "Unlocks at 9:28 AM ET, once the premarket watch list freezes." The live content is only available between the freeze and the close.
Float rotation as the ranking metric
The cleared names are ranked by float rotation, what the page calls "the metric that actually separates this universe." Float rotation is premarket volume divided by float. NXL's 15.5x means the entire float changed hands 15.5 times before the market opened.
The comparison across names on October 1 shows why this metric anchors the list. NXL's 652K float turned over 15.5 times on 10.1 million premarket shares. VEEA at 15.1x has similar rotation on a different share count and float size. LPA at 0.04x sits at the bottom of the intensity scale.
I find float rotation more useful than raw RVOL for comparing names to each other. RVOL scales to each name's own baseline, so 686x NXL and 10.4x VEEA are each expressing something about their own histories. Float rotation tells you how many times the actual available supply changed hands, which is the same question regardless of stock.
VEEA at 15.1x float rotation is close to NXL's 15.5x. The RVOL tells a different story: VEEA at 10.4x versus NXL's 686x. That spread comes from float size. Two metrics, each answering a slightly different version of the same question.
Key point: Float rotation and RVOL answer different questions. Rotation shows how many times the available supply changed hands. RVOL compares today's activity to this stock's own baseline. Use rotation to compare names to each other; use RVOL to understand each name's own history.
Green flags and red flags
Here's what I actually look at when I scan the cleared section:
Green: VERIFIED catalyst with float rotation above 10x. Two independent inputs pointing the same direction.
Green: Float under 10M. A 652K float creates different intraday dynamics than an 80M float stock at the same gap percentage.
Green: ATR above 1.5x. The gap covered more than one and a half normal daily ranges.
Green: RVOL well above the floor. 15x or 700x is a different story than 0.3x.
Red: Roundup-only catalyst on a thin setup. If the whole narrative is "stocks moved premarket," you're trading on nothing but the gap itself.
Red: RVOL near the floor in the cleared section. LPA at 0.62x is a different conviction level than VEEA at 10.4x.
Red: Float over 50M. The scan caps at 100M, but a 90M float name is a different setup from a 1M float name. Large floats can gap and grind; low floats make decisions faster.
Red: NO OPTIONS chip if you're planning an options trade. NXL showed NO OPTIONS on October 1. Know before the open.
Red: Checking after 10:00 AM and treating the frozen data as live. The list is a morning tool. After the first hour, setups have resolved.
Building a morning routine
- Read catalyst tags first. Separate VERIFIED from ROUNDUP and NONE before looking at gap percentages. That's the fastest read on whether a gap has a reason or is noise.
- Compare float rotation. NXL at 15.5x and VEEA at 15.1x are close, but NXL's 686x RVOL versus VEEA's 10.4x tells a different story about each stock's own history. Both are credible; they're different setups.
- Check the ATR multiple. A gap that covered more than 1.5x the daily range has different continuation dynamics than one that barely moved a single range.
- Check Live Flow for names with options after 9:30. Call buying on a name that cleared all five with a verified catalyst is a second signal pointing the same direction.
- Check Market Health before sizing. A risk-off regime changes what you can reasonably do with a volatile small-cap gap.
Try this: Open the page before the bell and read catalyst tags before looking at anything else. The tag answers whether the move has a reason. Everything else flows from that read.
Common mistakes
Reading a roundup as a catalyst. Someone opens the page, sees a news headline under a name, reads it as a reason the stock moved. The catalyst tag exists to prevent this. ROUNDUP means the article was about the gap.
Ignoring near misses. INSG at 99% of the RVOL floor is one more print from being on the list. FLNA at 19% is not. Read the bar.
Treating float size as interchangeable in the cleared section. The screen allows floats from 600K to 100M. A 99M float stock that cleared all five looks identical to a 600K float stock in the table, but the intraday mechanics are completely different. Float rotation corrects for this: a high-float stock with modest rotation is a different setup from a low-float name that changed hands 15 times premarket.
Entering without an opening range. The watch list is a shortlist. Buying at 9:31 without a level is chasing. Wait for the 9:30 to 9:45 range to form, then trade the break.
How it fits with the other tools
Live Flow is the per-ticker roll-up of the $20k+ options tape: total premium, trade count, bull/bear split, and the biggest recent print. After 9:30, checking whether any cleared names have options flow building is a natural second read.
Unusual Activity shows individual scored options prints. If a sweep lands on one of today's cleared names before the open, that's unusual flow on a name the gap scan already flagged.
Gap Continuation Scanner looks at names that gapped up at the open and held through the opening range. Did today's gappers continue or fade? It grades each name A through D by how many of three confirmations (GEX regime, options flow, sector flow) agreed with the move.
Sector Flow is the sector-level options flow dashboard. If a health technology name on today's list is also showing strong sector-level call flow, that's a regime reading behind the individual setup.
Market Health is the regime context. A risk-on day with bullish market bias is a different environment for a small-cap gap than a risk-off session.
Options trading and day trading involve significant risk of loss, including potentially more than the amount you invest. Nothing here is investment advice or a recommendation to buy or sell any security. The watch list is a scan result on a public universe. Every name here is a candidate for further research, not a trade.