The World Map combines a ten-layer geopolitical and infrastructure map with a live macro headline feed. This guide covers every layer, how to read the Wire panel, the gold-ringed stock-link system for premium members, and how to connect what you see on the map to positions you already hold.
Hey guys, Art from TraderMatrix here. The World Map is one of those pages that looks more complicated than it is. A dark map, ten toggleable layers, a headline feed, market clocks, a side panel that opens when you click certain sites. Once you understand what each piece is doing the whole thing takes two minutes to scan, and it gives you a context layer you can't get from a chart.
The short version:
- Ten layers: four live-polled (Earthquakes, Active Fires, Tropical Cyclones, Vessel Tracker) and six static infrastructure layers (Shipping Chokepoints, Major Mines, Power Stations, Chip Fabs, Refineries & LNG, Major Ports).
- Gold-ringed markers carry stock links. Click one and a premium side panel shows you the tickers it connects to, with live quotes.
- The Wire panel is open by default. It pulls from Benzinga, official government feeds (Fed, USTR, EIA, OFAC), and news sources (BBC, CNBC, Guardian, Al Jazeera). Filter by topic, source, or time window.
- Layer intel summarises each active layer: magnitude distribution for earthquakes, FRP for fires, throughput for chokepoints, GW by fuel for power stations.
- This is context, not a trade signal. Nothing on this page tells you to buy or sell anything.
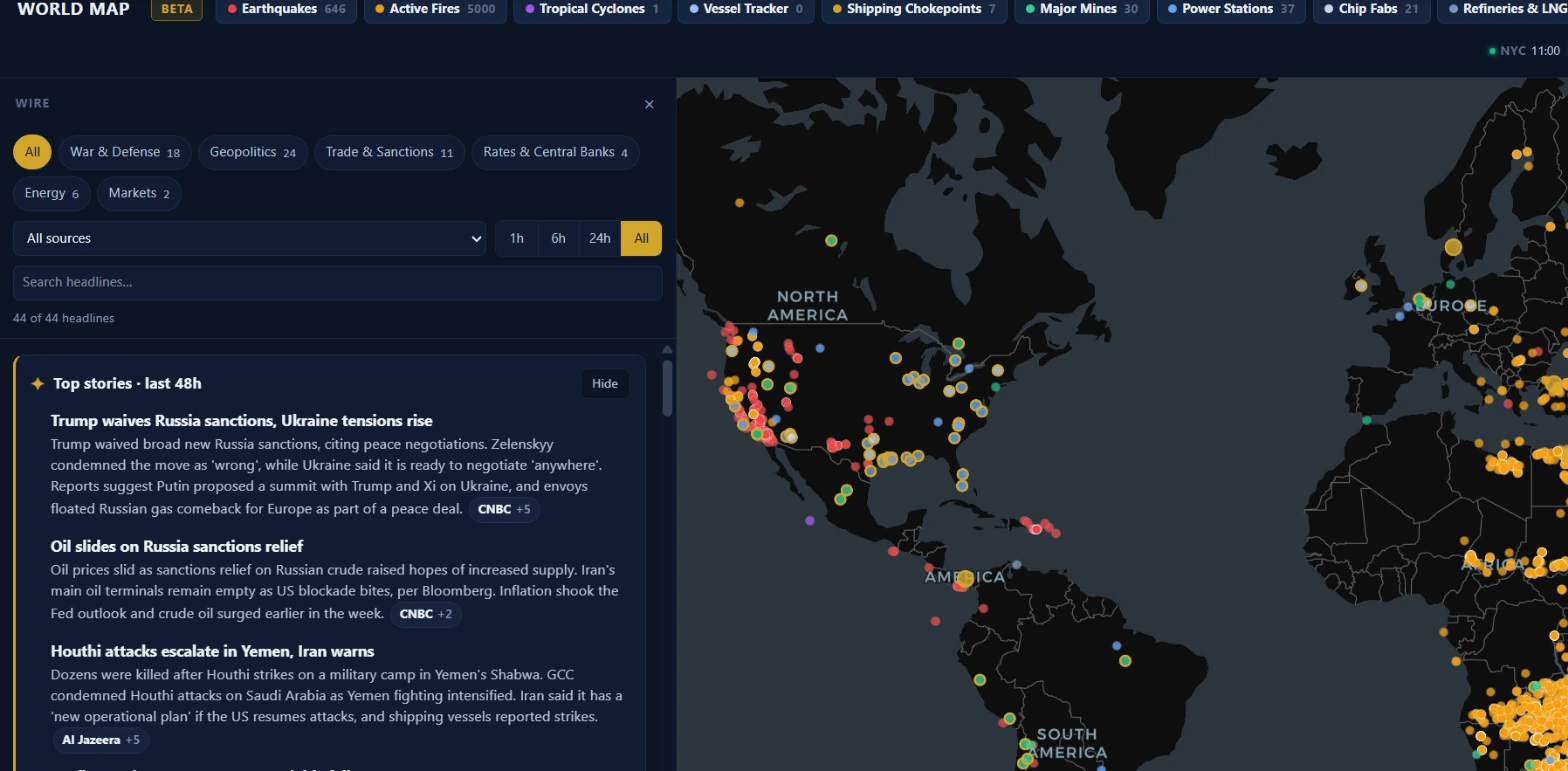 The page at a glance. Wire is open on the left by default. Layer chips across the top row let you toggle each data set on and off. Colored dots on the map correspond to each layer's assigned color in the chip bar.
What it is and who it is for
The World Map exists for one specific use case: macro context before and during a trading session. Not entries. Not exits. Context.
The things that move commodities, semiconductor stocks, energy companies, and shipping names often start as physical events somewhere in the world. A hurricane making landfall in the Gulf of Mexico, a conflict near the Strait of Hormuz, an earthquake near a major copper mine. By the time that event is priced into a chart, you've already missed the initial move. The World Map gives you a geographical picture of where those events are and what infrastructure they're near, alongside a live feed of the macro and geopolitical headlines that put words around what you're seeing.
The map works for anyone who trades names with real-world supply chain exposure: energy companies, miners, semiconductor stocks, shipping names, defense contractors. It's less immediately useful if you trade index options intraday and have no position with commodity or geopolitical exposure.
The top bar: layer chips, Wire, Layer intel, and clocks
Along the top of the page sits a row of chip buttons, one per layer. Each chip shows the layer name, a colored dot, and a count showing how many features are currently loaded for that layer. Clicking a chip toggles it on or off. All ten are on by default.
To the right of the layer chips are two buttons: Wire and Layer intel. They share the same sidebar slot, so only one can be open at a time. Wire is open by default.
Market clocks run on the far right: NYC, LDN, FRA, HKG, TYO, and UTC. A green dot on a clock means the exchange is inside its regular session window. These are based on standard session times only (exchange holidays are not reflected).
On mobile, the Wire covers the map full-width. A Wire / Map toggle at the top-left switches between them.
The ten layers
Earthquakes
Live-polled from seismic data. Each feature shows magnitude and place name when available. The map popup displays the magnitude and location when you click a dot. Layer intel shows the magnitude distribution (M6+, M5-5.9, M4-4.9, M2.5-3.9, below M2.5) along with a list of the three strongest events as fly-to links. Clicking a fly-to row centers the map on that event.
The red color matches the urgency you'd associate with a seismic event. For trading purposes, large earthquakes near major commodity infrastructure (a copper mine in Chile, oil pipelines in Alaska, refineries in Japan) are the ones worth pausing on.
Active Fires
Live-polled satellite detections. The metric the system tracks is FRP (Fire Radiative Power, measured in megawatts), which reflects how intense a given detection is. Layer intel lists the five highest-FRP detections as fly-to rows. The orange-amber color is the same across all fire markers; there is no magnitude scaling on the dots themselves.
Large fires in key agricultural regions can affect grain and food commodity prices. Fires near refineries or oil extraction areas are directly relevant to energy names.
Tropical Cyclones
Live-polled active storm data. Each storm is identified by name when one has been assigned. Layer intel shows each active storm with its current maximum winds in mph. If there are no active tropical cyclones, the panel says so explicitly.
Active storms in the Gulf of Mexico affect offshore oil production. Storms near major ports or shipping lanes affect container traffic and, by extension, the names that depend on it.
Vessel Tracker
Live-polled ship positions from AIS (Automatic Identification System). The blue dots show vessel positions within the latest AIS window. Layer intel notes the count of positions included but doesn't break down by vessel type. It's a density picture rather than a classified inventory.
Watch vessel density near major chokepoints. A thinner-than-normal cluster near the Strait of Hormuz or the Suez Canal, combined with news in the Wire about conflict or blockage, tells a more complete story than either data point alone.
Shipping Chokepoints
Static infrastructure data. Twelve sites including the Strait of Hormuz, the Suez Canal, the Strait of Malacca, the Panama Canal, and others. Chokepoints use a larger marker than other layers to make them visible at low zoom. Layer intel ranks them by oil throughput in millions of barrels per day.
These are the bottlenecks where a disruption has global commodity consequences. Most chokepoint markers carry a gold ring, meaning they link to stocks. The side panel for a chokepoint shows the energy names and shipping companies most directly exposed to disruption there.
Major Mines
Static data covering significant mining operations. Layer intel breaks them down by primary commodity: copper, gold, iron ore, lithium, and others. There is no production volume breakdown in the current dataset; the layer shows location and primary commodity only.
When you see an earthquake, flood, or wildfire near a cluster of copper or lithium mines, check Layer intel to understand the commodity concentration, then bring that back to the names in your watchlist.
Power Stations
Static data. Layer intel shows mapped capacity in gigawatts broken down by fuel type: coal, gas, nuclear, hydro, wind, solar, and others depending on what's in the dataset. The headline reads "X GW mapped capacity, by fuel."
This layer is most useful for grid-stress analysis during heat events or severe weather. An extended heat wave over a region served predominantly by one fuel type shows up as a density cluster here.
Chip Fabs
Static data showing major semiconductor fabrication facilities. Layer intel breaks them down by company. Fabs for the major foundry operators are included.
This is the layer to check when a geopolitical event creates headline risk for semiconductor stocks: typhoon season in Taiwan, tensions in the South China Sea, an earthquake near a fab cluster. The geography of where chips are actually made matters more than most people realize when they're reaching for the obvious ticker.
Refineries & LNG
Static data covering petroleum refineries and LNG export terminals. Layer intel shows the split between refineries and LNG export sites, plus a country breakdown. The dataset distinguishes LNG export terminals from standard refinery entries.
Natural gas and petroleum product names respond quickly to refinery and LNG terminal disruptions. A hurricane track overlapping this layer is a direct read on downstream price pressure.
Major Ports
Static data. Layer intel ranks ports by annual throughput in millions of TEU (twenty-foot equivalent units). The top eight appear as fly-to rows so you can center the map on any port and inspect its position relative to nearby chokepoints or vessel traffic.
Port congestion affects shipping names directly and indirectly affects any manufacturer that depends on just-in-time inventory through that port.
Layer intel panel
Click Layer intel in the top bar to open it. The panel closes Wire if Wire was open, since they share the same sidebar slot.
Each active layer gets a card showing its total feature count, a headline stat, and a list of rows. Rows with a fly-to arrow let you click to center the map on that feature and, for stock-linked features, open the linked-stocks panel simultaneously.
The hint at the bottom of Layer intel reads: "Gold-ringed sites link to stocks. Click one to see the tickers it moves." That's the only prompt the page gives you about the premium feature.
Gold rings and linked stocks (Premium)
Some map features carry a gold ring instead of the standard white outline. Gold means the backend has a curated stock-link record for that feature: a list of tickers and a short reasoning note connecting the site to those names.
Clicking a gold-ringed marker opens a linked-stocks panel on the right edge of the map. The panel shows the feature name, its layer, the linked tickers with live quotes, and the reasoning text.
This feature requires a Premium subscription. Clicking a gold-ringed marker without Premium shows an upgrade prompt.
Stock links exist on static layers only. Chokepoints, mines, chip fabs, refineries, and ports carry them; live-polled layers like earthquakes and vessels do not. The number of linked sites per layer depends on the curated dataset.
Key point: The stock-link reasoning tells you why a site connects to a ticker. Read it. "Strait of Hormuz linked to XOM, CVX" with reasoning about oil transit is very different from a connection built on loose thematic overlap.
The Wire panel
The Wire is a filtered macro and geopolitical headline feed. It's open by default on both desktop and mobile.
Sources
The feed pulls from four categories:
- Official (tagged as such in the source filter): Federal Reserve, USTR (US Trade Representative), EIA (Energy Information Administration), and OFAC (Office of Foreign Assets Control, sanctions oversight). These are government feeds. An OFAC action against an oil company lands here before any news outlet picks it up.
- Benzinga: a financial wire service, keyword-filtered for macro and geopolitical relevance.
- News (BBC, CNBC, Guardian, Al Jazeera): for broader international coverage.
The source dropdown in the "More filters" section lets you limit the feed to one category. Filtering to Official only shows you government actions without the news noise.
Topics
Six topic chips run along the top of the Wire: War & Defense, Geopolitics, Trade & Sanctions, Rates & Central Banks, Energy, and Markets. Each chip shows a count of how many headlines in the current view match it. A chip showing 0 is grayed out.
Chips work as an OR filter when you select more than one. Selecting War & Defense and Energy shows headlines tagged with either topic.
Time windows
The time segment buttons (1h, 6h, 24h, All) filter by publication time. Official feeds that publish date-only items (OFAC gives no time of day, only a date) are treated as "today" for any window when the date matches today in Eastern time. This prevents a same-day sanctions action from disappearing from the "1h" filter.
Headline search
The search box under "More filters" matches against headline text and source name. It is free-text search, not a symbol lookup.
Place chips and map integration
When a headline mentions a location the system recognizes, a small place chip appears under the headline. Clicking the chip flies the map to that location. On desktop, if the location corresponds to a chokepoint with stock links, clicking the chip opens the linked-stocks panel directly. On mobile, a badge on the Wire toggle shows how many headlines mention the feature you just tapped on the map, so you can flip to the Wire with the filter pre-set.
This two-way connection is the most useful part of the page. A headline about shipping disruption near the Bab el-Mandeb strait, a place chip under that headline, and a gold-ringed chokepoint marker at that location all point at the same event. The stock-link panel then surfaces the names most exposed to it.
Top Stories
At the top of the Wire feed, above the headline list, sits a Top stories card. It shows an AI-generated summary of the biggest macro and political stories from the last 48 hours, built from the same headlines in the Wire. Each story cites the headlines it came from; clicking the source chip expands the source list.
The card includes a note: "AI summary of the last 48h of macro and political headlines. Check the sources before trading on it." That's worth taking literally. The summary is a starting point, not a final read.
Headline tape
A scrolling tape at the very bottom of the page runs the latest Wire headlines continuously. Each item shows the source and headline text. Clicking a tape item opens the original article in a new tab.
Three worked examples
1. Typhoon season, chip fabs, and semiconductor names
It's August. A typhoon is approaching Taiwan. You open the World Map. You toggle off the layers you don't need (fires, ports, mines) and keep Tropical Cyclones and Chip Fabs on. The cyclone layer shows a storm moving toward the island. You open Layer intel and look at the Chip Fabs card. The rows show the major fab operators with sites on the island.
You switch to the Wire. You filter by the Geopolitics chip and the Trade chip. You see headlines covering the storm's projected track and any government statements.
You open Ticker Search for the fab operators and check their options flow on the Unusual Activity page. You're not making a trade yet. You're building a picture: physical risk, news context, and existing flow. If the flow on semiconductor names starts showing unusual put activity alongside the storm headlines, that's a convergence worth watching.
2. Chokepoint news and energy names
A conflict escalation is being reported near the Strait of Hormuz. You open the Wire and filter to Energy and War & Defense. Several headlines carry those tags. One of them has a place chip for the Strait of Hormuz. You click the chip. The map flies to the Strait. The gold-ringed chokepoint marker is visible. You click it and the linked-stocks panel opens, showing the energy names most directly exposed to transit disruption there.
You go to the Heat Map page. You check whether any energy names appear colored with UNUSUAL badges. If the flow and the geopolitical news are both pointing in the same direction, you have two separate data sources aligned. If the flow is flat while the news is loud, that gap is information too.
3. Earthquake near a copper mine cluster
Layer intel for Major Mines shows a cluster of copper mines in northern Chile. The Earthquakes layer shows a recent M5.8 event within a hundred kilometers of that cluster. You click the fly-to row in the earthquake's Layer intel card to center the map on the event, then check the mines layer to see how close the impact zone is to active operations.
You filter the Wire to Geopolitics and search for "copper." You check whether any mine-operator names are showing unusual flow on the Unusual Activity page. You check the Sector Flow page for the materials sector. You're triangulating from the physical event toward the financial signal, rather than the other way around.
Common mistakes and how to read this responsibly
Treating physical proximity as a trade signal. An earthquake near a mine does not mean the mine is damaged. A storm near a refinery does not mean the refinery is offline. The map shows you where events are relative to infrastructure. Whether that infrastructure is actually affected requires news verification, not just map proximity.
Acting on Wire headlines without reading the source. The place chips and topic tags make headlines easy to filter. That speed cuts both ways. Before sizing a position based on a headline, click through to the original source and read the full article. A headline tagged as OFAC-official might be a minor administrative action rather than a major sanctions regime change.
Treating the Top Stories summary as a primary source. The AI summary is synthesized from the same headlines you can read directly. It's a starting point for knowing what to look into, not a research conclusion.
Conflating the map's coverage with the world's total risk. The ten layers cover specific categories. A cyber attack on financial systems, a regulatory change affecting a sector, or a labor strike at a port don't show up on this map. Use it for what it covers.
Using it alone. The World Map works best in combination with flow data, sector data, and options positioning. A physical event on the map, unusual flow in the affected names, and a sector-level lean in the same direction is a much more complete picture than any one of those three data points on its own.
How it pairs with other tools
Sector Flow shows which sectors are attracting premium and in which direction. When a physical event on the World Map falls within a sector that's already showing bullish or bearish flow, the two data sets are pointing at the same story from different angles.
Unusual Activity shows the individual options prints. After identifying a potentially affected name from the World Map's stock-link panel, Unusual Activity is where you check whether real money is actually moving in that name's options market.
Market Health gives you the broader risk backdrop. An infrastructure event or geopolitical escalation reads differently when you know whether the overall market is in a Risk-On or Risk-Off posture.
News Wire covers a broader set of financial news sources than the World Map's Wire. The World Map Wire is filtered specifically for macro and geopolitical content. If you want earnings news, Fed statements, or sector earnings beats alongside your market data, the main News Wire carries more of that.
Ready to look at the page? Open the World Map →
Nothing in this guide is a recommendation to buy or sell any security. Geopolitical and physical events affect markets in complex and unpredictable ways. Physical proximity on a map is context, not a trade signal. Past correlations between world events and market moves don't predict future results.