
Signal Scanners deep dive · 23 min read
How to Read the Reversal Finder
A plain-English walkthrough of TraderMatrix's 9-signal exhaustion composite: how each indicator votes, what the threshold means, and how to use POTENTIAL TOP and POTENTIAL BOTTOM signals without acting on noise.
Open the tool →Hey guys, Art from TraderMatrix here. Today we're going deep on the Reversal Finder, and I want to do it properly because this page gets used wrong more often than it gets used right.
Before we touch anything on the page I need to explain what this tool actually measures. If you skip this section and go straight to the cards, you will misread every signal you see.
The short version:
- Nine indicators each cast one vote: +1 for overbought, -1 for oversold, 0 for neutral. A score of +5 or higher fires POTENTIAL TOP; -5 or lower fires POTENTIAL BOTTOM.
- The signal fires on the first day the composite crosses the threshold, not while it sits there.
- Most useful for covered call candidates (tops) and cash-secured put candidates (bottoms).
- A high composite score with below-average volume is a weaker read than one with 2x volume backing it.
- Cross-reference GEX for structural price anchors and Unusual Activity to check whether options flow agrees.
What exhaustion means (and what it does not)
The word "reversal" is in the name. It does not mean the scanner predicts reversals. What it measures is exhaustion: the condition where multiple momentum and oscillator indicators are simultaneously flashing extreme readings on a single stock. Exhaustion and reversal can look identical from a distance, but they are different in a way that matters for how you use the data.
When retail traders get excited about a stock that has been running, they tend to pile in late. When they get scared about something falling, they dump it indiscriminately. Both behaviors show up as stretched technical readings across multiple indicators at once. The Reversal Finder catches that moment when the crowd is maximally committed in one direction.
The page uses the term "dumb money" without apology. It means retail positioning at extremes, not that retail is necessarily wrong. What it means is that when RSI is maxed out, Stochastic is maxed out, Williams %R is maxed out, and four other indicators are all saying the same thing simultaneously, you are probably looking at a short-term exhaustion point. Whether the stock actually turns from there is a separate question that the composite alone cannot answer.
The two practical use cases are: covered calls when something you own looks euphoric, and cash-secured puts when something you want to own looks like it is in panic. Both strategies benefit from elevated implied volatility, which tends to be elevated precisely when people are scared or greedy.
Key point: The composite measures extremes in retail positioning, not the market's next move. When five or more of nine indicators independently hit overbought or oversold at the same time, the crowd is maximally committed in one direction.
Nine votes, one composite
Nine technical indicators, each casting exactly one vote: +1 for overbought, -1 for oversold, 0 for neutral. Add them up. Range is -9 to +9.
A POTENTIAL TOP fires the first day the composite reaches +5 or higher, coming from below +5 the day before. A POTENTIAL BOTTOM fires the first day the composite hits -5 or lower, coming from above -5. The transition is the signal, not just sitting at the level. A composite that has been at +7 for four sessions in a row is not generating fresh signals.
The threshold was raised to 5 from 4 in September 2026 because signals at the minimum were producing too much noise. Five out of nine aligned is a meaningfully different quality of read than four.
Watch out: The transition fires the signal, not the level. A composite sitting at +7 for four sessions is an existing condition, not a new one. Look for the fresh crossing.
The page, top to bottom
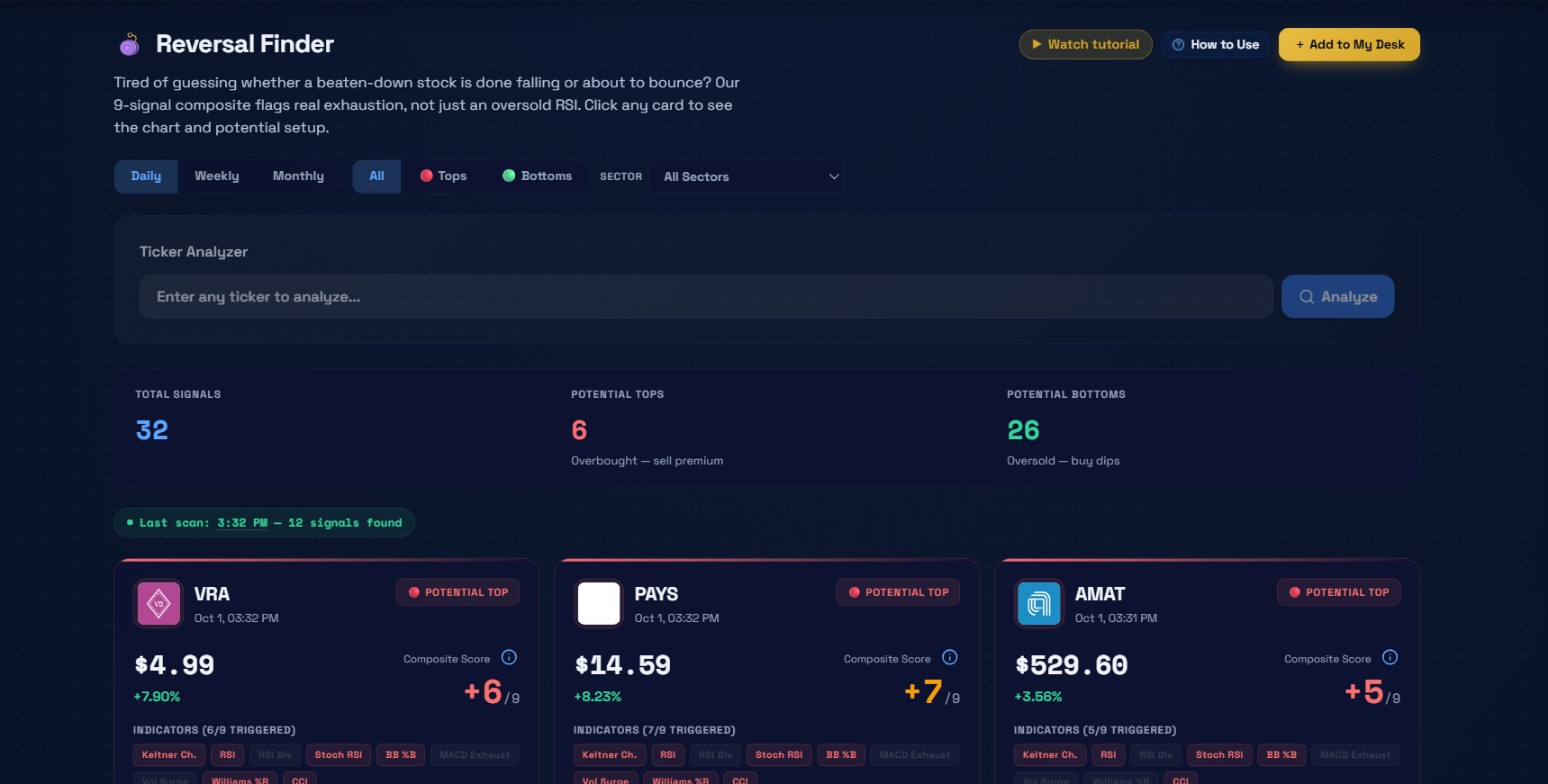 October 1, 2026 after the close. 32 total signals: 6 potential tops, 26 potential bottoms.
The header
The page opens with "Reversal Finder" and a subtitle: "Tired of guessing whether a beaten-down stock is done falling or about to bounce? Our 9-signal composite flags real exhaustion, not just an oversold RSI. Click any card to see the chart and potential setup."
Three buttons sit to the right: Watch tutorial, How to Use, and Add to My Desk. How to Use opens a sidebar with detailed descriptions of all nine components and usage notes. Add to My Desk drops the scanner as a module onto your desk.
The controls
Timeframe: Daily, Weekly, Monthly. Daily is the default and what you will use most days. The composite runs on daily bars. Weekly applies the same nine indicators to weekly candlestick data, giving a higher-timeframe view that fires less frequently but tends to carry more structural weight. Monthly is the slowest.
Direction: All, Tops, Bottoms. All shows everything. Tops filters to red POTENTIAL TOP signals. Bottoms shows green POTENTIAL BOTTOM only. Start with All to see what the market produced, then switch to the direction you care about.
Sector. Filters using the same sector taxonomy as the Sector Flow page. Selecting Technology shows only signals from that sector. This filter applies against the full database rather than just the loaded cards, so you are not missing anything.
The Ticker Analyzer
Below the controls is a text input. Type any ticker and hit Analyze. This runs the same 9-component composite against any name you enter, regardless of whether it would appear in the scan results. Useful when you already have a thesis on a specific name and want to see where its exhaustion composite sits right now without scrolling through the full card grid.
The stat tiles
Three summary tiles:
Total Signals - count of unique tickers that crossed a threshold. October 1, 2026: 32.
Potential Tops - how many crossed +5, labeled "Overbought - sell premium." That session: 6.
Potential Bottoms - how many crossed -5, labeled "Oversold - buy dips." That session: 26.
A session with 26 bottoms and 6 tops is itself information. That skew appears on broad market selloff days. When you see a 4:1 ratio like that, the scanner is capturing a widespread oversold condition, not isolated single-name exhaustion.
The last scan badge
A small pill shows when the last scan ran and how many signals it found. The data reflects settled daily bars.
What is on each card
Each card is one ticker where the composite crossed a threshold.
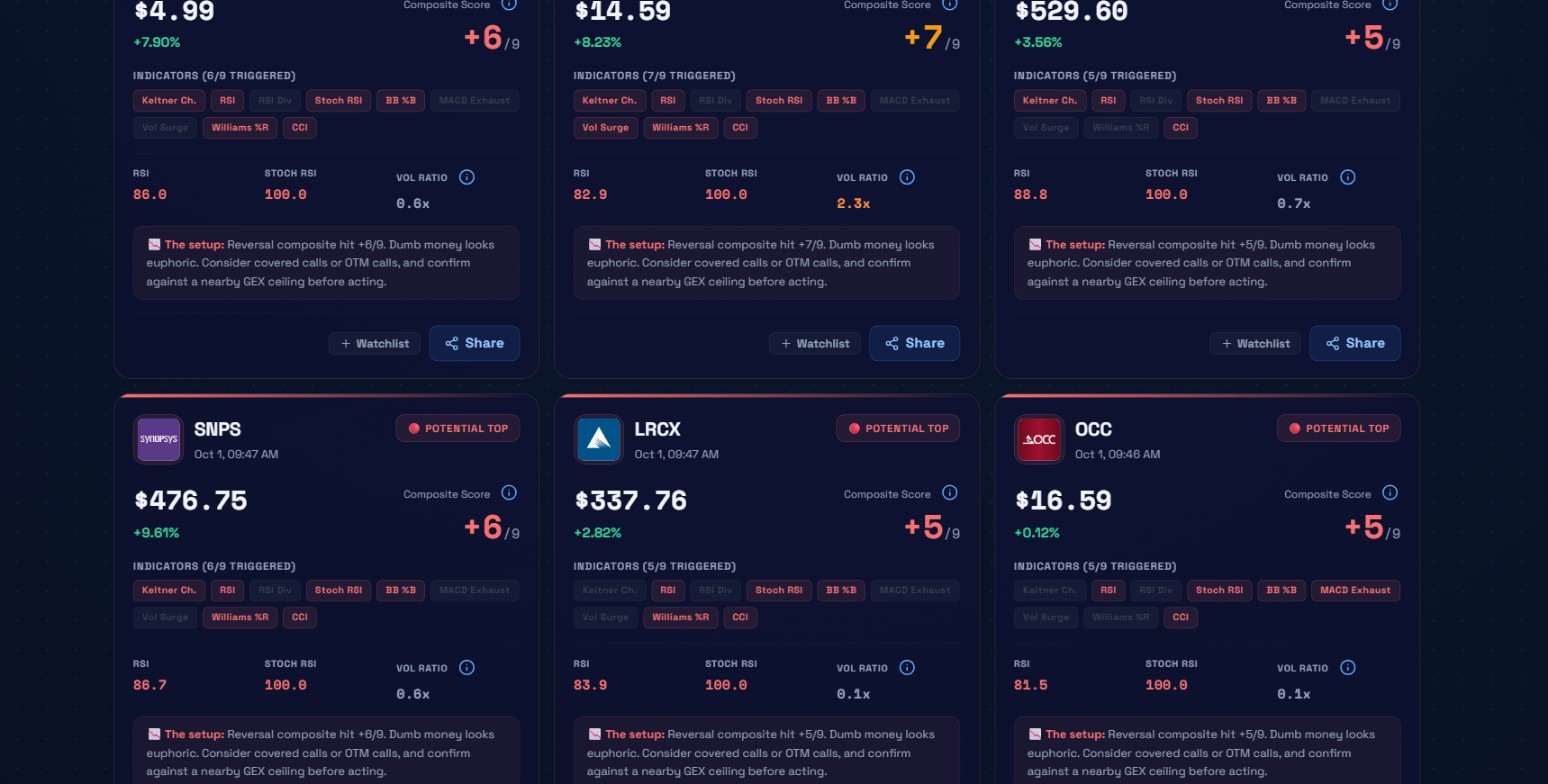 The six POTENTIAL TOP signals from October 1. Scores from +5/9 on AMAT, LRCX, and OCC up to +7/9 on PAYS. SNPS at +9.61% had the biggest daily gain in the group.
Badge. Top-right corner: "POTENTIAL TOP" in red or "POTENTIAL BOTTOM" in green.
Ticker and timestamp. The symbol with the detection time below it.
Price and daily change. VRA: $4.99, up 7.90%. The daily change gives immediate context on whether the stock is moving on real volume or just drifting.
Composite Score. "+N/9" or "-N/9" in large type on the right side, color-coded by magnitude. Amber at 7 or above, signal color (red or green) from 5 to 6. VRA showed +6/9; PAYS showed +7/9.
Indicators chip row. Nine pills, one per component. The ones that voted in the signal's direction light up. The ones that did not fire stay dim. The header above shows the count: "INDICATORS (6/9 TRIGGERED)" for VRA. Hover any chip for a tooltip explaining what that specific indicator measures.
One thing worth noting: the triggered count and the composite score can differ by one or two. That happens when a component votes against the signal direction. If six components vote -1 for a bottom but one votes +1 (for instance, RSI divergence formed a bearish pattern at the same time), the composite is -5 and the triggered count shows 6. It is not a display error.
Stats row. Three numbers: RSI value, Stoch RSI, and Vol Ratio. RSI colors red above 70, green below 30. Stoch RSI colors red above 80, green below 20. Vol Ratio turns yellow at 3x, orange at 2x, gray below. VRA on October 1: RSI 86.0, Stoch RSI 100.0, Vol Ratio 0.6x. That 0.6x vol ratio is worth pausing on: the composite was stretched but volume was actually below average that day. You can build a case for a covered call, but the signal is not backed by unusual participation.
Watch out: Volume ratio is on every card for a reason. A composite at +6/9 with 0.6x volume means the indicators fired but nobody showed up to confirm them. Compare PAYS at 2.3x volume to VRA at 0.6x: both triggered, but they are not the same quality of read.
Setup note. At the bottom of every card: a plain-English description of what the reading implies. For tops: "Reversal composite hit +6/9. Dumb money looks euphoric. Consider covered calls or OTM calls, and confirm against a nearby GEX ceiling before acting." For bottoms: "Reversal composite hit -5/9. Dumb money looks like it's in despair. Consider cash-secured puts or a dip buy, and confirm with flow before acting." Starting point, not a trade instruction.
Watchlist and Share buttons. Watchlist adds the ticker to your list. Share mints a branded reversal card showing the score and chart.
The nine components, in detail
Most people note how many chips lit up and move on. That is leaving a lot on the table. Which specific components fired matters because some are highly correlated with each other and some are mechanically distinct. Understanding what each one measures lets you judge whether a +6/9 represents genuine breadth of evidence or six versions of the same read.
The composite is computed in Python against daily OHLCV data using Wilder's smoothing, matching the original PineScript indicator the platform was built from.
| Component | What it measures | Fires +1 when | Fires -1 when |
|---|---|---|---|
| Keltner Channel | Whether price closed outside its ATR-based volatility envelope | Close above upper band | Close below lower band |
| RSI (6-period) | Short-term price momentum | RSI at or above 80 | RSI at or below 25 |
| RSI Divergence | Structural momentum divergence (pattern-based) | Price new high, RSI lower | Price new low, RSI higher |
| Stochastic RSI | Where RSI sits within its own 14-day range | Both K and D at or above 80 | Both K and D at or below 20 |
| Bollinger Band %B | Where price sits within the Bollinger Band range | %B at or above 0.90 | %B at or below 0.10 |
| MACD Exhaustion | Whether the MACD histogram is rolling over | Histogram peak (momentum fading) | Histogram trough (selling losing steam) |
| Volume Surge | High-volume direction confirmation | 2x volume average, close above open | 2x volume average, close below open |
| Williams %R (50-period) | Position within the 50-bar high-low range | Reading above -20 | Reading below -80 |
| CCI (14-period) | Deviation from 14-period SMA | CCI above +120 | CCI below -120 |
Keltner Channel (14-period EMA, 2.0x ATR multiplier)
A Keltner Channel wraps a 14-period EMA with upper and lower bands derived from Average True Range. Close above the upper band: +1. Close below the lower band: -1.
ATR-based bands scale to each stock's actual volatility. A high-beta name has wide bands; a low-vol name has narrow ones. This indicator asks whether the stock has closed outside its own volatility envelope, not whether it hit some absolute threshold.
RSI (6-period, overbought at 80, oversold at 25)
Six periods is a short lookback by traditional standards. The shorter window makes this respond faster to recent moves. RSI at or above 80 scores +1; at or below 25 scores -1.
The thresholds are not symmetric: 80 on the upside, 25 on the downside. Strong stocks can stay above 70 for extended periods in real bull moves, so the overbought bar is high. Panic-driven selloffs happen fast, so the oversold bar is lower. VRA's RSI was 86.0 on October 1, well past 80. A stock with RSI at 26.1 on a day the composite hits -5 is above the 25 threshold, meaning RSI itself would not contribute -1 to the score. The other four components fired while RSI stayed neutral.
RSI Divergence (pivot-based, 5/5 bars)
This one works differently from the rest. Instead of measuring a current level, it looks for a structural pattern: price made a new high but RSI failed to confirm it (bearish divergence, +1), or price made a new low but RSI held higher than the prior low (bullish divergence, -1).
The algorithm detects pivot highs and lows using a 5-bar window on each side: a bar is a pivot high if it is higher than the five bars before it and the five bars after it. The divergence is confirmed 5 bars after the pivot. When the most recent confirmed price pivot high is higher than the one before it but the matching RSI pivot high is lower, that is bearish divergence. The reverse pattern for lows is bullish divergence.
This is the one component that fires based on the structure of the move rather than a single-bar threshold. It adds a point when momentum was already fading before the price extreme was reached.
Key point: RSI Divergence fires on the shape of the move, not a threshold. It catches fading momentum before the price peak or trough arrives. When this component lights up alongside oscillator extremes, the signal has structural backing.
Stochastic RSI (14-period RSI, K smooth=1, D smooth=1, overbought at 80, oversold at 20)
Stochastic applied to RSI rather than directly to price. The calculation places the RSI value within its own 14-day high-low range: 100 means RSI is at the top of that range, 0 means it is at the bottom.
K and D smooth factors are both 1, meaning no additional smoothing beyond the raw stochastic. Both K and D need to be at or above 80 simultaneously for +1, and both at or below 20 for -1. On October 1, VRA, PAYS, AMAT, SNPS, LRCX, OCC, and several bottoms all showed Stoch RSI at either 100.0 or 0.0. When this many names simultaneously pin the Stoch RSI at its ceiling or floor, it tells you the session itself was extreme.
This indicator resets faster than plain RSI because it is a second derivative.
Bollinger Band %B (14-period, 2-standard-deviation bands)
%B measures where today's close sits within the full Bollinger Band range. A reading of 1.0 means price is at the upper band; 0.0 means at the lower. %B at or above 0.90 scores +1; at or below 0.10 scores -1.
The 0.90 threshold means the stock does not need to close above the upper band, just within the top 10% of it. The computation uses population standard deviation (dividing by N, not N-1), matching the original PineScript behavior.
MACD Exhaustion (fast=5, slow=12, signal=9)
This component does not check whether MACD is positive or negative. It detects when the momentum histogram is rolling over from a peak or turning up from a trough. A histogram peak: yesterday's histogram was positive and larger than the day before, today's histogram is positive but smaller than yesterday's. A histogram trough is the opposite pattern in negative territory.
The fast period of 5 is shorter than typical MACD settings. The histogram rollover is a classic early warning that buying or selling pressure is losing steam even when price has not yet turned.
Volume Surge (14-period average, 2.0x threshold)
Volume divided by the 14-day volume average. If volume is at least 2x average and the close is above the open: +1. If volume is at least 2x and the close is below the open: -1. Normal-volume days score 0.
The volume ratio appears as a separate stat on each card. PAYS on October 1 showed 2.3x, meaning volume was more than twice its recent average on a day the stock rose 8.23%. That is the kind of confirmation that makes a top signal more credible. VRA at 0.6x is the opposite: the composite fired, but nobody showed up to the party.
Try this: When reviewing any top or bottom signal, check vol ratio first. A ratio at 2x or above means real participation backed the signal. Below 1x, the composite fired but the crowd did not show up.
Williams %R (50-period lookback, overbought above -20, oversold below -80)
Williams %R measures where today's close falls within the 50-bar high-low range. The scale runs from 0 to -100 (inverted). Readings above -20 score +1. Readings below -80 score -1.
The 50-period lookback is the longest in the composite. A stock needs to have been pushing in one direction for a meaningful stretch before Williams %R registers overbought. It catches medium-term structural extremes rather than short-term noise.
CCI (14-period, overbought above +120, oversold below -120)
Commodity Channel Index measures how far the typical price (average of high, low, and close) deviates from its 14-period SMA, scaled by mean absolute deviation. Readings above +120 score +1; below -120 score -1.
The scaling constant 0.015 is a Lambert-standard factor that puts roughly 70-80% of CCI readings within the -100 to +100 range under normal conditions. When CCI clears +120 or -120, the statistical deviation is genuinely large.
How the scores add up, and the candle gate
Eight components can each contribute +1 or -1 on any bar. RSI Divergence is the ninth and contributes the same way, but it fires through pattern detection rather than a threshold breach. Composite is the straight sum: range -9 to +9.
There is one additional quality check that applies only to POTENTIAL TOP signals, not to bottoms. A top only fires if the triggering candle is either a bearish close (price closed at or below the open) or a green candle where the upper wick is at least 20% of the full high-to-low range. A clean bullish candle with no upper wick rejection does not pass, even if the composite crossed +5. The logic: a top signal on a candle showing zero distribution is weaker evidence. VRA on October 1 passed this gate: the stock closed up 7.90% but the candle carried enough upper wick to qualify.
Working through October 1
The six POTENTIAL TOP signals from that session ranged from +5/9 on AMAT, LRCX, and OCC up to +7/9 on PAYS.
PAYS at +7/9 is the highest conviction in that group. Price $14.59, up 8.23%, RSI 82.9, Stoch RSI 100.0, vol ratio 2.3x. Seven of nine components aligned and volume confirmed real participation. Before putting on a covered call, the first check would be the GEX chart: is there a dealer positioning level (Apex level) nearby above current price? If so, you have both a technical read (exhaustion composite) and a structural reason (gamma resistance) pointing the same direction.
AMAT at +5/9 is a different story. RSI 88.8, Stoch RSI 100.0, vol ratio 0.7x. Right at the threshold with below-average volume. AMAT at $529.60 is a large-cap semiconductor with significant GEX exposure. A minimum-threshold signal at 0.7x volume in a name that size is a flag to watch, not a trigger to act on.
LRCX showed RSI 83.9, Stoch RSI 100.0, vol ratio 0.1x on October 1. Volume at 0.1x average on a day it gained 2.82%. That is the weakest vol ratio of the entire top group. OCC at +5/9 was similar: +0.12% price change, RSI 81.5, 0.1x volume. The composite crossed because slower-moving indicators aligned, not because of any unusual price behavior.
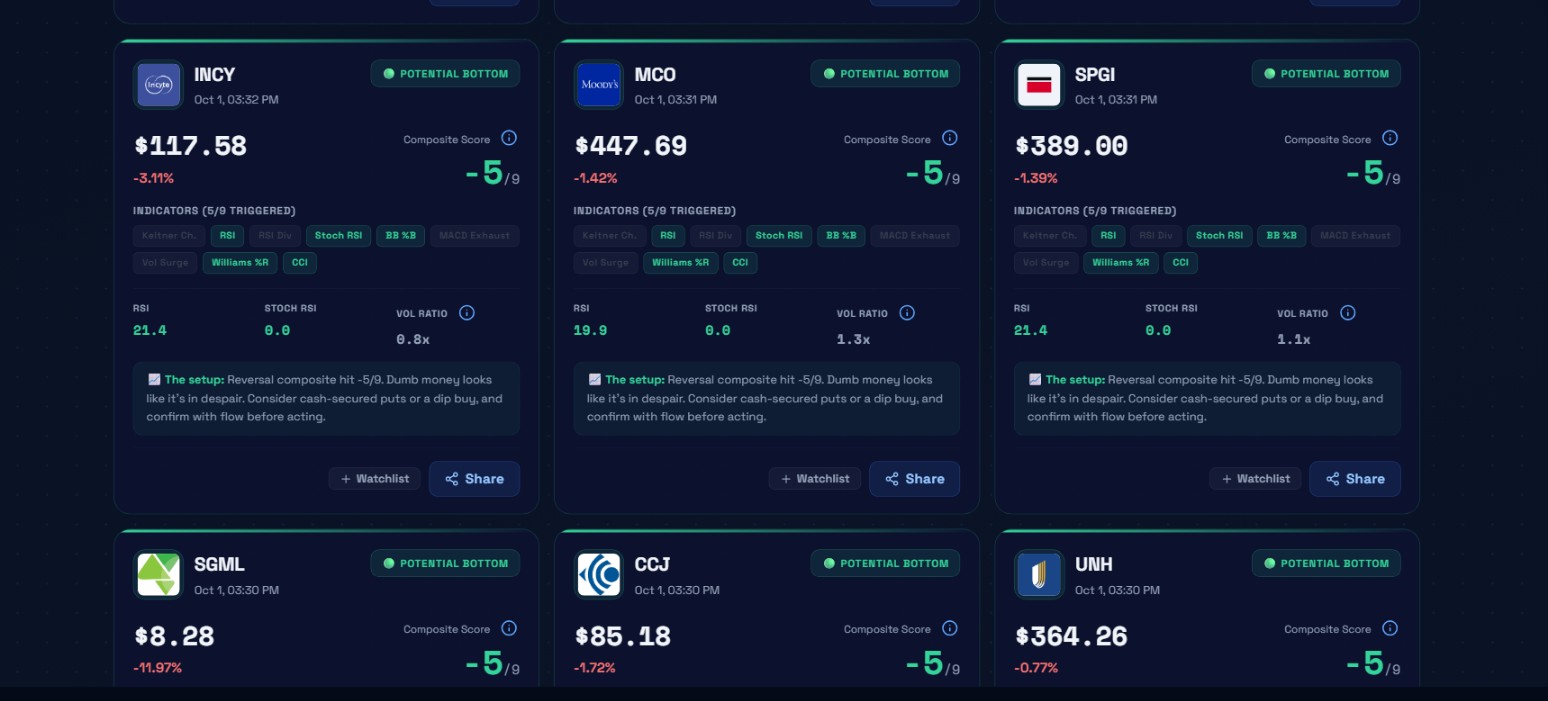 POTENTIAL BOTTOM signals from October 1. INCY, MCO, and SPGI are all at -5/9. SGML dropped 11.97% on the day, the sharpest single-session move in the group.
The bottoms section had 26 names on October 1. When you see a number that large at once, the scanner is doing exactly what it was built for: identifying widespread oversold conditions during a market selloff. But a large batch of bottom signals on a bad market day does not by itself mean anything has bottomed.
SGML dropped 11.97% on the day, the sharpest single-session move in this batch. A drop that large almost always has a catalyst. Find out what happened before forming any view. If it was a news event or a fundamental change, the stock may have permanently repriced and the composite is measuring the event, not structural exhaustion. Those are different situations.
Watch out: A composite firing on a name down 20% or more almost always has a catalyst behind it. Find the news first. Measuring an event is different from measuring structural exhaustion, and those two situations require different responses.
INCY at -5/9 showed RSI 21.4, Stoch RSI 0.0, vol ratio 0.8x, down 3.11%. Five components aligned with below-average volume. MCO at -5/9 had RSI 19.9, Stoch RSI 0.0, vol ratio 1.3x, down 1.42%. Both are at the composite floor. MCO's vol ratio of 1.3x means modestly above-average selling backed the signal; INCY at 0.8x was below average.
MCO and SPGI, both at -5/9, are large financial data companies trading around $448 and $389 respectively. Both were down roughly 1.4% on the day, which is a normal-sized selloff, not a capitulation. Quality names at minimum-threshold readings are interesting for cash-secured puts if you like those businesses at lower prices, but they are not urgent.
The chart modal
Click any card and a modal opens for that ticker.
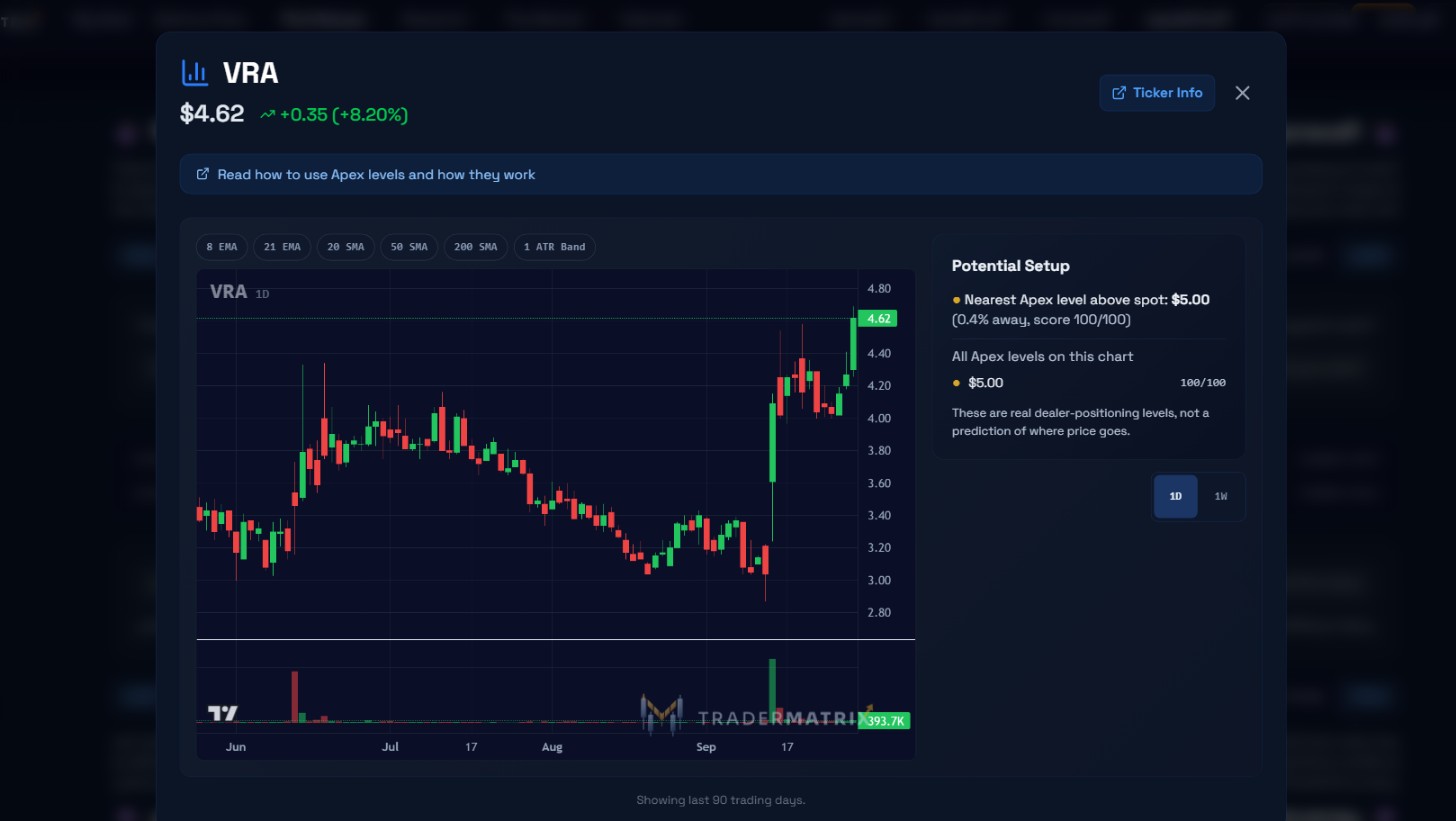 The VRA chart modal on October 1. The $5.00 Apex level sits 0.4% above spot, scored 100/100. The chart covers 90 trading days, roughly June through October 2026.
The modal shows price and daily change at the top. VRA: $4.62, +0.35 (+8.20%).
The chart covers the last 90 trading days as a daily candlestick view. Overlay toggles let you add moving averages: 8 EMA, 21 EMA, 20 SMA, 50 SMA, 200 SMA, and a 1 ATR Band. A volume panel runs below the candles.
The Apex level appears as a dashed orange horizontal line. For VRA on October 1, the nearest Apex level was at $5.00, scored 100/100, which the panel labels 0.4% away. Apex levels come from the GEX system and represent price zones where options dealer positioning creates a gravitational pull. A maximum-score Apex level at $5.00 with VRA trading at $4.62 is about as close a setup as you will see: the composite says retail is stretched and there is a known gamma ceiling right above.
The Potential Setup panel on the right lists the nearest Apex level and all levels on that chart. For VRA: "Nearest Apex level above spot: $5.00 (0.4% away, score 100/100)." Below the level list: "These are real dealer-positioning levels, not a prediction of where price goes." A 1D/1W toggle at the bottom right switches the chart between daily and weekly views without leaving the modal. A Ticker Info link in the top-right corner opens a deeper view of the name.
Use the modal to gut-check whether the price action context supports the composite reading. A stock that has been grinding up for six weeks and is now pressing against a GEX ceiling is a different setup than one where the composite fired during a one-day spike with no clear structure behind it.
Weekly and monthly views
Switching to Weekly runs the same composite on weekly candlestick bars. A weekly POTENTIAL TOP or BOTTOM carries more structural weight because it is measuring exhaustion across a broader range of price history. These signals fire less often and the implied volatility context is typically different.
Monthly is the slowest. Monthly signals tend to correspond with genuine regime-level exhaustion rather than the short-term swings that show up on Daily.
Each timeframe is independent. A stock can appear on Daily and not on Weekly because daily bars can be extreme while weekly bars are not. When a name shows up on both simultaneously, that overlap is worth paying attention to.
Key point: A name showing exhaustion on both the daily and weekly composite at the same time is a much stronger read than one where only the daily crossed the threshold.
Pairing with other tools
The Reversal Finder is a starting signal. The first natural check is the GEX page for the ticker. POTENTIAL TOP plus a strong Apex level nearby above price gives you a mechanical anchor for a covered call strike. POTENTIAL BOTTOM plus gamma support below price gives you a structural reason the stock might stabilize near a specific level.
Unusual Activity (/unusual-activity) is the scored feed, one print per row. If a name shows a POTENTIAL TOP at +7/9 but the options tape that day is full of call buying, those two signals contradict each other. The composite says retail is stretched; the tape says someone is still putting on bullish positions. That is a conflict worth knowing about before selling premium.
Sector Flow (/sectors) is the sector dashboard. A POTENTIAL BOTTOM in a healthcare name during a session where healthcare sector flow is heavily negative is a weaker setup than the same signal in a sector that is neutral or beginning to recover. The stock can be locally oversold while the sector is still being sold.
Live Flow (/live-flow) is the per-ticker roll-up of $20k+ options tape, with cards showing total premium, trade count, bull/bear split, and the latest big print. Worth a look after a reversal signal fires to see whether today's options activity in that name is aligned with the composite or working against it.
Dark Pool (/dark-pool) covers off-exchange block prints. Earnings Flow (/earnings-flow) shows pre-earnings positioning cards by ticker. Heat Map (/heat-map) is an urgency board of ticker tiles showing broad activity levels. None of these directly confirm or deny a reversal signal, but they add context about what the options and institutional tape is doing in names where the technical composite is extreme.
Building a routine
Open the Reversal Finder after the close on days when the market had a clear directional move. Broad selloff days generate many bottoms. Ripping up days generate tops.
Use the sector filter first. If you only follow a few sectors, filter immediately rather than scrolling through 30 cards looking for names you would never trade.
Within each direction group, pay attention to composite magnitude. A PAYS at +7/9 deserves more attention than an OCC at +5/9 on the same day. The minimum threshold is the floor, not the target.
For each name that interests you: open the chart modal. Check the Apex levels. Check the daily change and whether there was news. If the stock was down 20% on a bad announcement, the composite is reflecting that event, not a technical exhaustion point. If the stock has been grinding lower for two weeks with no catalyst and the composite just crossed -5, that is a cleaner setup.
After that: check GEX for structural levels, check flow for what options traders are doing.
Green and red flags
Stronger signals:
- Composite at +7 or above for tops, -7 or below for bottoms. Five of nine is the floor; seven means most indicators independently arrived at the same reading.
- Mechanically distinct components firing together. Keltner Channel, MACD Exhaustion, and Williams %R each measure something different. When those three fire alongside two oscillators, that is broader evidence than five momentum oscillators all reading the same stretch.
- Volume ratio at 2x or above. PAYS at 2.3x was more credible than LRCX at 0.1x, even though both were +5 or higher.
- Gamma level nearby in the reversal direction. An Apex level close to the signal provides a structural reason for the move to stall at a specific price.
Weaker setups or reasons to wait:
- Earnings within the next few sessions. These can reset all exhaustion readings.
- Composite still expanding toward the extreme (it was -4 yesterday, -7 today). The exhaustion is still building, not finishing.
- Sector flow strongly against the signal direction.
- A name that has been at the same extreme composite for multiple consecutive days. The transition already fired; you are looking at a persistent condition, not a fresh signal. The context determines whether that is exhaustion winding down or a trending environment.
Common mistakes
-
Trading the minimum threshold as a strong signal. A +5/9 barely crosses the bar. Four components are neutral. In a strong trending market, a 5 can persist for multiple sessions. Act proportionally.
-
Ignoring which components fired. Two names at +5/9 can have completely different signal quality. Keltner Channel, RSI Divergence, MACD Exhaustion, and two distinct oscillators firing together is broader evidence than five momentum oscillators all reading the same stretch.
-
Skipping the flow check. The Reversal Finder is purely technical. A complete exhaustion composite with heavy institutional call buying on the tape is a conflict worth understanding before selling covered calls.
-
Not checking for news. A composite firing on a name that just repriced on news is measuring the event, not structural exhaustion. Those two situations require different responses.
There is a question I cannot answer here: what is the expected reliability difference between a +5/9 signal and a +8/9 signal in a trending market versus a ranging one? The composite tells you about the current extreme; it does not weight for market regime. That is something you have to bring yourself.
What the composite does not see
-
Macro context. The nine components are derived from price and volume only. They do not see credit spreads, interest rate policy, or bond market signals. A POTENTIAL BOTTOM in a rate-sensitive name during tighter policy conditions may be measuring the wrong exhaustion point.
-
Persistence. Once a name crosses the threshold, it stays visible. A name that first crossed -5 a week ago and has been at -7 for several sessions is not a fresh signal. The transition fires on the first crossing.
-
Timing. A reading can be correct about the exhaustion and wrong about when it ends. You sell a cash-secured put, the composite says oversold, the stock falls for two more weeks. The exhaustion was real; the selling just was not finished.
Nothing here is financial advice. Options trading involves real risk and you can lose the full premium paid or face assignment on a short put. Use the composite as one input among others.