Loading...

Markets & Smart Money deep dive · 14 min read
How to Use Politician Trades
A complete walkthrough of the congressional trades feed at /politicians. Three tabs, six table columns, and a 45-day disclosure lag that reframes how to use every row on the page.
Open the tool →Hey guys, Art from TraderMatrix here. The page I want to walk through is Politician Trades, under Calendars & Intel in the nav. It lives at /politicians. Before you read a single row of data, there is one thing worth internalizing: every trade you see happened up to 45 days before the disclosure dropped.
The STOCK Act (2012) requires members of Congress to disclose personal trades within 45 calendar days of execution. That clock runs on calendar days, not business days. A trade executed on a Friday is already two days into the window by Sunday. And a filing dropped on day 44 describes something that happened a month and a half ago.
That constraint does not make the tool useless. It makes it a specific kind of tool, suited to specific uses.
The short version:
- Congressional trades must be disclosed within 45 days under the STOCK Act. The lag is the defining fact of the page.
- Data comes from official House Clerk and Senate eFD filings, public record, not a licensed feed.
- Three tabs: Recent Trades (free, last 90 days), Top Portfolios (premium, ranked by estimated dollar volume), Most Active (premium, ranked by trade count).
- Amount brackets like "1K-15K" or "100K-250K" are what the law requires. Exact sizes are not part of the filing.
- Use this as a watchlist builder and a confirmation layer, not a timing entry signal.
What this tool is and what it isn't
There is a common misreading that catches people on the first visit. They treat a filing like a live alert: a member disclosed a large purchase, so get in now. That framing ignores the lag entirely.
A trade disclosed today happened somewhere between yesterday and 45 days ago. The price moved on the trade date. By the filing date, whatever informed the decision, a committee briefing, a pending regulatory vote, a contract in the pipeline, was already up to 45 days in the past. Entering on the disclosure date means entering after the initial move.
What the data actually gives you is a record of conviction held. A senator who disclosed a large purchase almost certainly still holds the position. Congressional portfolios are not high-frequency accounts. The lag is a holding-period floor. If a member took a position for a multi-month thesis, reading about it in week two or three still leaves most of that window open.
The right question to ask on each row is: given that this trade happened and the person probably still holds it, does the underlying thesis have any life that current live tools can confirm?
Opening the page
Before looking at any trade, check two things.
The first is the STOCK Act disclosure delay banner across the top of the page. It reads: "Congressional trades are disclosed with a lag (up to 45 days from execution). Trades shown may already be past their initial move." This banner stays visible on every tab.
The second is the freshness line just below it. On the screenshot below, that line reads "Disclosures updated 2 days ago · newest trade on file Oct 12, 2026." It shows when the feed was last updated and what the most recent transaction date on file is. The page also shows an explicit staleness banner when the feed goes too long without new filings. Either way, checking the freshness line on every visit takes five seconds and saves you from trading off data that is older than it appears.
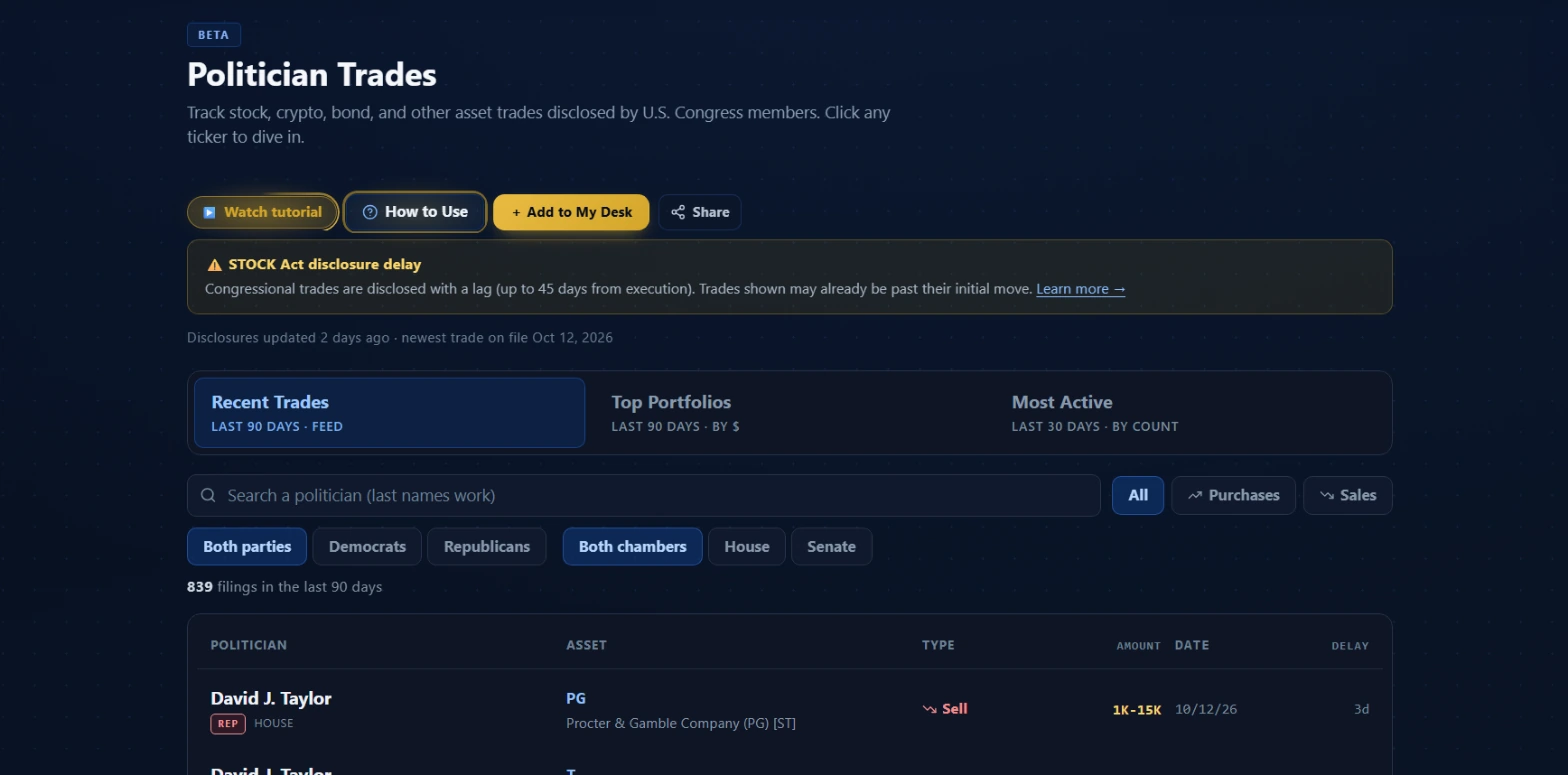 The page as it loads. The delay banner and freshness line stay across all three tabs. Before any filters, the feed shows 839 filings from the last 90 days.
The three tabs
Recent Trades is the default and is free to all members. It shows a flat feed of the last 90 days of disclosures, one row per filing, sorted newest first. Free accounts see the first several rows with a gate below showing additional locked rows. Premium members see the full 90-day feed.
Top Portfolios is a premium tab. It ranks politicians by estimated total dollar volume across the same 90-day window, derived from bracket midpoints. The table shows each person's top tickers, total trade count, and date of last filing. Clicking a row opens Ticker Search for their most active name.
Most Active is also premium. It ranks by raw trade count over the last 30 days rather than dollar volume, and shows each member's single most-traded ticker. Someone filing ten small-bracket trades ranks here even if their dollar total is modest by leaderboard standards.
The two leaderboards answer different questions. Top Portfolios shows where dollar conviction is concentrating. Most Active shows who is trading most frequently. A politician near the top of both tabs in the same ticker, high estimated dollar volume and high trade count, is worth pulling up in the Recent Trades search to read the full pattern across 90 days.
Filters and search
All four filter controls sit above the table on the Recent Trades tab.
Search box: searches by politician name, last names work, with autocomplete populated from names present in the current feed. Typing a last name filters the table immediately. Use it to pull up a specific member's history within the 90-day window, or to check whether someone who surfaced elsewhere has been active recently.
All / Purchases / Sales: the trade-type filter. Purchases shows only buy filings. Sales shows only sell filings. Most traders focus on the buy side, which means the sell side is systematically underread. A large sale from a committee-relevant member in a name you already hold from a different signal is worth knowing about. Run the Sales filter regularly, not just when looking for entries.
Party filter: Both Parties, Democrats, Republicans. This works as a clustering tool, not a political one. When members from both parties purchase the same ticker in the same window, it reads differently than single-party positioning. Bipartisan buying of the same name is the rarest pattern on this page and, when it appears, the most structurally interesting.
Chamber filter: Both Chambers, House, Senate. Senators serve six-year terms and tend to hold positions longer. House members file more frequently with shorter horizons. Neither chamber produces inherently higher-signal trades, but knowing which chamber filed can inform how long a conviction might persist.
Table columns
Politician: Name, party pill (DEM, REP, IND), and chamber label. Clicking any name in the table filters the feed to show that member's full 90-day trading history. Committee assignment is the single most important context for any filing and is not on this page. You need to look it up separately from congressional websites.
Asset: Ticker symbol and company name. Most filings cover equities, shown with a clickable ticker that opens Ticker Search for that name. Non-equity assets, bonds, crypto, certain mutual funds, appear with a "Non-Stock" tag and no ticker link since there is no options chain to drill into.
Type: Purchase or Sale as filed. Watch for rows labeled Gift, Exercise, or Inheritance when they appear. These are required disclosures but carry no investment thesis. The page labels them distinctly rather than styling them as purchases or sales.
Amount: The STOCK Act bracket. Not the exact dollar amount. Federal law requires disclosure in specific ranges: roughly $1K-$15K, $15K-$50K, $50K-$100K, $100K-$250K, $250K-$500K, $500K-$1M, and $1M or above. The page shows compact labels like "1K-15K" or "100K-250K." Treat these as order-of-magnitude reads. A "100K-250K" bracket means the actual trade was somewhere in that band. The leaderboard tabs use midpoint estimates for ranking, but the real execution size is unknown.
Date: The trade date, not the filing date. This is when the transaction happened. For thinking about how much thesis window remains, anchor to the trade date.
Delay: Days from the trade date to when the disclosure was filed. STOCK Act allows up to 45. A delay of 3 means the member filed within three days of the trade. A delay of 43 means they waited near the deadline.
Short delays on large purchases deserve more attention. When someone files within a few days, the sequence was: trade, then disclose soon after. A 3-day delay on a $250K purchase in a committee-relevant name has a different character than a 44-day delay on a small bracket. The latter could be many things, including a scheduled plan execution or a routine rebalance that almost missed the window. The former is faster than anyone in a hurry to comply would need to be.
Reading the amounts
The $1K-$15K bracket is background noise for most members of Congress, who have substantial declared net worth. A $15K purchase is not a meaningful expression of conviction from a sitting senator. The brackets that matter start around $100K-$250K, and the $1M or above bracket is the strongest single-filing read the page can show.
Scale the bracket against context. A $50K purchase from someone with eight figures in disclosed holdings is not the same conviction signal as the same bracket from someone with a smaller portfolio. The Top Portfolios leaderboard accounts for this implicitly: members who rank highest have the largest cumulative estimated exposure.
One thing the page does not show: purchase price per share. You know the bracket. You do not know the cost basis or whether the position is currently above or below the entry. That gap matters when a name is sharply off its price from two months ago.
Three ways to use this in practice
Building a watchlist from a sector pattern
You notice several filings in a specific sector over a few weeks, from members with relevant committee assignments, at meaningful bracket sizes. No single filing is conclusive. As a group, they suggest something is building. You add the most liquid name in that sector to your watchlist. You then open Unusual Activity and run the name through Ticker Search to check whether the options tape points the same direction. When congressional filings and current live flow agree independently, the thesis has two sources. You wait for a technical entry rather than chasing the disclosure date.
Cross-referencing a position you already hold
You hold a name from a sweep that printed a few weeks ago. You search for the ticker in the Recent Trades feed. You find two rows: a purchase at $100K-$250K from about the same time as your entry, which supports the direction, and a more recent sale at $50K-$100K from a different member. The sale does not necessarily invalidate the trade. It could be a routine rebalance, a planned sale, or a different thesis entirely. But it is a second data point telling you someone with policy visibility reduced exposure. You tighten your stop rather than adding.
Using the leaderboards together
On the premium tabs, you pull Most Active to see who filed the most trades in the last 30 days. You cross-reference the top names against Top Portfolios to see whether the most active traders are also holding the largest estimated positions. A member near the top of both tabs in the same ticker is worth pulling into the Recent Trades search. Reading their full 90-day history shows whether they are building a position steadily over multiple filings or executing a scheduled plan. Consistent, increasing purchases of the same name over several months reads differently from a cluster of small trades spread across many tickers.
Pairs with
| Tool | What it adds | When to use it |
|---|---|---|
| Unusual Activity | Live options tape scored by the anomaly engine | Confirm whether the options market currently agrees with a congressional purchase |
| Ticker Search | Full historical options flow per ticker | Drill into a name from the politician feed to see multi-week accumulation or distribution in the options tape |
| Insider Activity | SEC Form 4 filings from corporate officers and directors | A name with both congressional purchases and cluster insider buys has two separate institutional signals pointing the same direction |
| Dark Pool | Off-exchange equity block prints | Check whether equity block flow agrees with a congressional purchase; two independent sources agreeing is the actual signal |
| Hedge Fund Tracker | Daily ETF holdings diffs and quarterly 13F positioning | If the same name shows congressional buying, insider buying, and growing fund positions in the same window, the thesis has three legs |
Common mistakes
Trading on the day the filing drops
The filing describes a trade from up to 45 days ago. The entry price from the disclosure date has nothing to do with the entry price from when the trade was actually placed. Entering on the filing date is entering after the initial move. The right response to a compelling new filing is to add the name to a watchlist and wait for a live trigger before taking any position.
Reading a bracket as exact
"$100K-$250K" means somewhere in that range. It might be $105,000. It might be $240,000. Treat brackets as order-of-magnitude signals: small brackets are noise, large brackets are worth attention. Never derive a position size from a bracket midpoint.
Ignoring the sell side
The Purchases filter gets more attention than Sales. That asymmetry means sell filings are consistently underread. A large sale by a committee-relevant member in a name you hold from another signal is worth knowing about. Run the Sales filter on any name you are actively watching and check whether any recent exits showed up before you add to a position.
Acting on a single filing
One disclosure has too many innocent explanations to act on alone: a pre-scheduled 10b5-1 plan execution, an advisor-managed account rebalance, a gift or inheritance disclosure, shares sold to cover a vesting tax bill. The signal comes from patterns: the same name across multiple members in a short window, repeated purchases from one member in the same ticker across several filings, or a cluster of buys in the period leading up to a known legislative calendar event. Single rows are starting points, not conclusions.
Missing the freshness line
The line below the delay banner shows when disclosures were last updated and what the newest trade date on file is. A feed with a two-week-old newest trade date is a different dataset than one updated two days ago. Check it on every visit. When the staleness banner appears, treat everything in the table as historical context rather than current intelligence until it clears.
What the tool does not tell you
Congressional disclosures are required filings, not voluntary transparency. The information is public, but the reasoning behind each trade is almost never visible.
A purchase could reflect information advantage from committee work. It could equally be an advisor-managed account executing a scheduled rebalance, a 10b5-1 plan running on a pre-set timer, or a household member's decision. Spouses and dependent family members are covered by disclosure requirements, and some filings come from spousal accounts with separate advisors who may not share the member's knowledge. The filing shows you that a transaction occurred. It does not tell you why.
Committee assignments are public record and often the most important context for any filing, but they are not on this page. A tech-sector purchase from a Senate Commerce Committee member reads differently than the same purchase from a member with no relevant committee assignment. You need to look up committee assignments separately.
The STOCK Act also exempts certain investment vehicles. Widely diversified mutual funds and index accounts are not subject to disclosure. A member can hold a large equity portfolio through a broad fund without a single row appearing on this page. What you see is the personally-directed trading layer on top of whatever managed accounts they hold.
None of this means the data is useless. It means it reads most clearly when paired with tools that give you a current view of the same name. Congressional flow sets a watchlist. Unusual Activity, Dark Pool, and Ticker Search provide the live confirmation that the thesis still has legs before you act on it.
Congressional stock disclosures are public record sourced from House Clerk and Senate eFD official filings. They do not constitute investment advice and do not predict future price movement. Trade amounts are midpoint estimates of STOCK Act-required dollar range brackets. Purchase price per share is not part of the official filing and is not shown here. Nothing in this guide is a recommendation to buy or sell any security.