Loading...

Options Screeners deep dive · 18 min read
How to Use the Momentum Pullback Screener
The Momentum Pullback screener finds stocks in confirmed multi-timeframe uptrends that have cooled off to a tight entry zone. Full walkthrough: the EMA cascade that qualifies the trend, both scanning modes, the seven-component Entry Quality Score, and how to read the real results from October 1, 2026.
Open the tool →Hey guys, Art from TraderMatrix here. The Momentum Pullback screener is the first one I built for this platform, and it is still the one I use most. Quiet afternoon, want a list of setups worth watching over the next week or two? This is where I start.
The job is specific: find stocks in a confirmed uptrend across multiple timeframes that have pulled back to a tight, defensible entry zone. The trend has to be verified on the daily, weekly, and monthly charts. Price has to be close to the anchor level. The risk/reward on a continuation trade has to be worth it. That combination is rarer than it looks on any given day, which is a feature, not a bug.
The EMA rules, the mode switch, and the score all make a lot more sense with the underlying concept, so let me walk through that first.
The short version:
- Standard mode requires the EMA cascade on daily, weekly, AND monthly charts. Bullish Pullback drops the monthly gate and tightens the stochastic to below 30.
- The Entry Quality Score (0-100) combines seven factors. Pullback Depth (25 pts) and ATR Distance to EMA21 (20 pts) carry the most weight.
- An intact five-EMA stack (EMA8 above EMA21 through EMA89) on the daily chart is the core trend filter. One EMA out of order fails the setup.
- Check INST for large negative streaks and EARNINGS for proximity before acting on any result.
- Grade A+ starts at 85. A result in grade C or D passed the regime filters but has multiple soft scoring components.
What a pullback in a trend actually is
A trending stock does not go straight up. It runs, then pauses, then runs again. The pause is the pullback. Short-term traders take profits, oscillators cool off, and the stock gives back some of the recent gain. If the trend is healthy, buyers come back, the oscillators turn up, and the stock continues. If the trend is failing, the pullback keeps going.
Distinguishing a healthy pause from the start of a breakdown is genuinely hard. Both look the same in the moment. That is the exact problem this screener tries to solve.
The approach is inspired by the pullback-to-the-mean approach Simon Ree teaches in The Tao of Trading. This is our own independent implementation, not affiliated with or endorsed by Simon Ree or Tao of Trading, and it is not a replica of his setup. It uses five exponential moving averages to define trend: the 8-period, 21-period, 34-period, 55-period, and 89-period EMAs, all on the daily chart. When they are stacked in order (EMA8 above EMA21, EMA21 above EMA34, EMA34 above EMA55, EMA55 above EMA89), every velocity of trend is aligned bullishly. Short-term momentum, intermediate momentum, and long-term momentum are all pointing the same way. One EMA out of order means the stack is broken, and the stock fails the filter.
The entry zone comes from what the methodology calls the rubber band rule. When price pulls back toward EMA21 while the entire stack remains intact, the distance between price and EMA21 is the tension in the setup. The screener filters for stocks within one ATR of EMA21. ATR (average true range) is the average daily price range the stock moves under normal conditions. Within one ATR of EMA21 means close enough that a normal day's movement could reach it.
Three more daily requirements: the 50-day SMA must be above the 200-day SMA (the golden cross regime), price must be above the 200-day SMA (long-term trend intact), and ADX must be between 20 and 60. ADX below 20 means the trend lacks enough momentum to be worth trading. The upper bound of 60 is a screening cap we chose, not a measured exhaustion level.
Then Stochastic %K must be below 40. Stochastic measures where price sits within its recent range. Readings below 40, and especially below 20, signal that short-term momentum has cooled off enough that the pullback is real. A reading near 80 means you are buying into strength, not a pullback, which is a worse entry profile for a mean-reversion continuation trade.
Key point: The EMA stack is the trend filter and the rubber band is the entry filter. A five-EMA stack intact while price pulls back close to EMA21 is the specific combination the screener hunts.
Standard mode versus Bullish Pullback
The screener has two modes, toggled at the top of the page.
Standard is the strict version. Beyond the daily requirements above, it also requires the EMA cascade confirmed on the weekly chart (EMA8 above EMA21 through EMA89 on the weekly, plus SMA50 above SMA200 weekly, plus weekly ADX above 20) and on the monthly chart (same EMA cascade, plus SMA50 above SMA200 monthly). When all three timeframes agree, the trend is verified at every meaningful investment horizon. On October 1, 2026, Standard mode with defaults returned three setups.
Bullish Pullback drops the monthly gate entirely and tightens the stochastic requirement from below 40 to below 30. More hits, earlier in the pullback, before the monthly chart has confirmed the move. Some of those setups will not follow through because the monthly trend has not validated yet. Others will, and you will be in them earlier.
My default when markets are trending cleanly is Standard. When the broad market has been choppy and confirmed setups are scarce, I switch to Bullish Pullback to keep a working list going.
Watch out: Scores from Standard mode and Bullish Pullback are not directly comparable. A score of 70 under Standard, which required monthly confirmation, reflects different conditions than a score of 70 under Bullish Pullback.
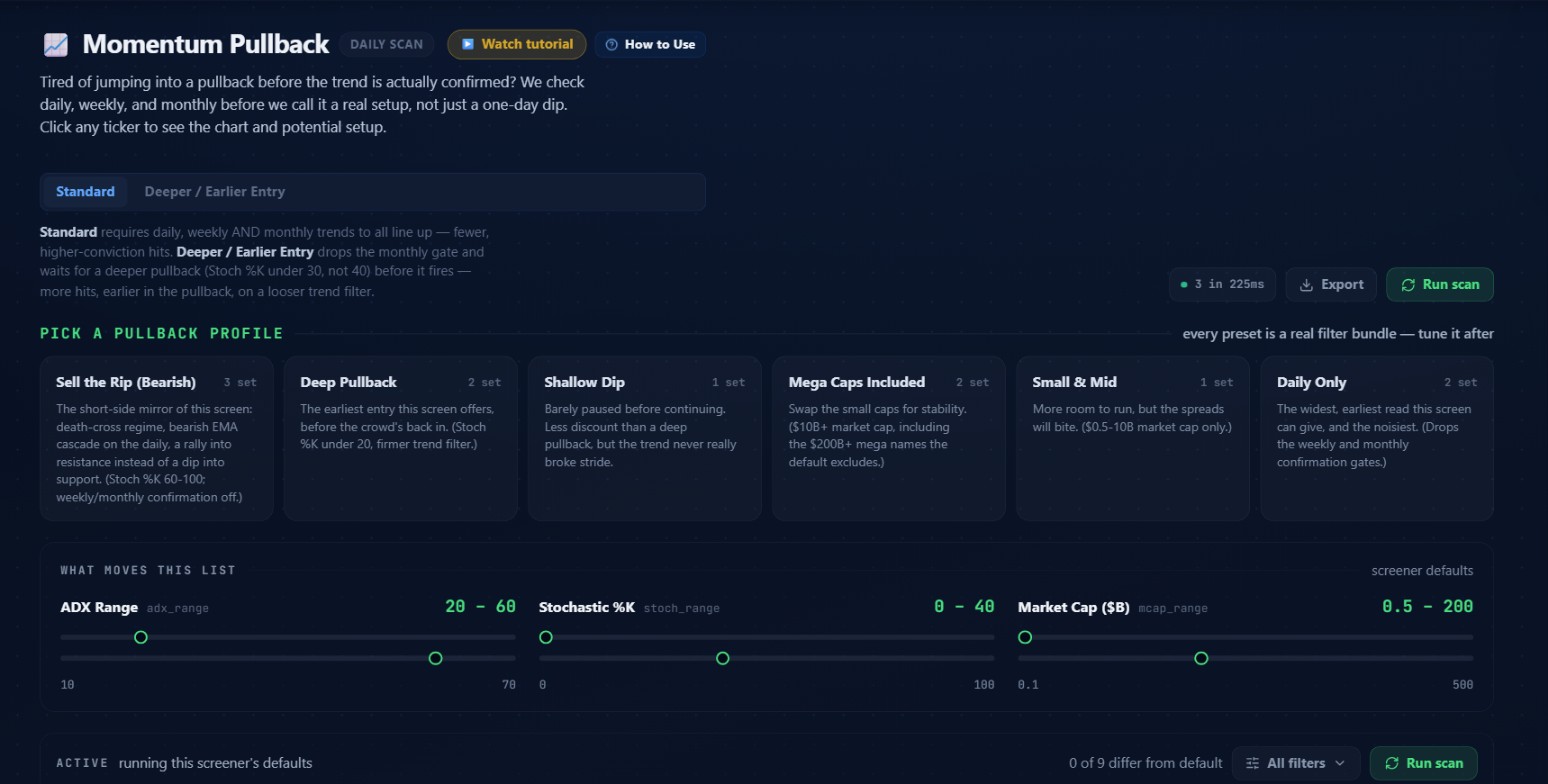 The Momentum Pullback page on October 1, 2026, after the close. Standard mode is active. The description under the mode tabs explains the difference: monthly confirmation requirement and the Stochastic threshold.
The preset cards
Below the mode toggle, six preset cards sit under the heading "PICK A PULLBACK PROFILE." Each one is a real filter bundle that runs immediately when clicked.
-
Sell the Rip (Bearish): the short-side mirror of the screener. Instead of a bullish EMA stack in golden-cross regime, it looks for stocks in a bearish EMA cascade (8 below 21 below 34 below 55 below 89) where price has rallied into resistance. The stochastic is mirrored to the overbought side. A "0-40" stochastic setting in the UI translates to Stoch %K between 60 and 100 for bearish setups. Weekly and monthly confirmation are turned off here on purpose: requiring a full bearish EMA cascade on the monthly chart means multi-year secular decline territory, and that stacked with an overbought daily stochastic returned zero rows every session during testing in a bull tape.
-
Deep Pullback: tightens the stochastic from 0-40 down to 0-20 and raises the ADX floor from 20 to 25. The preset to reach for when you want the most compelling risk/reward entries rather than just passing candidates.
-
Shallow Dip: sets the stochastic range from 25 to 40. The stock barely paused. Less discount but potentially a healthier trend that never really faltered.
-
Mega Caps Included: raises the market cap ceiling to 500 billion and removes the 200 billion default cap. Apple, Microsoft, Google, and similar names can now appear. The default keeps mega-caps out because a pullback to EMA21 on a multi-trillion dollar company plays differently than on a five billion dollar mid-cap.
-
Small & Mid: restricts to 0.5 billion to 10 billion market cap. More room to run, but spreads are wider and options liquidity thins out.
-
Daily Only: drops both weekly and monthly confirmation gates. The description on the card is honest: the widest, earliest read this screener can give, and the noisiest. Useful occasionally to see what is in the pipeline before the higher timeframes catch up.
After clicking a preset, the sliders and filter drawer reflect what changed, and you can adjust from there.
The three hero sliders
Just below the preset cards, three sliders labeled "WHAT MOVES THIS LIST."
ADX Range (default 20-60): ADX measures trend strength without any directional bias. It does not tell you whether a stock is going up or down, only how strongly it is trending. Twenty is the minimum for a confirmed trend. Forty is strong. The default upper bound of 60 is a screening cap we chose, not a measured exhaustion level. Raising the lower bound to 25 or 30 tightens to stronger-trend candidates.
Stochastic %K (default 0-40): Pullback depth. Zero is the deepest oversold reading. Forty is the upper boundary the screener accepts. The stochastic slider is the most sensitive control on the page, because pullback depth drives the largest single component of the Entry Quality Score.
Market Cap $B (default 0.5-200): Market capitalization in billions. The floor at 0.5 keeps out micro-caps. The ceiling at 200 keeps out mega-caps unless you specifically want them.
The nine filters
The ACTIVE chip in the filter bar shows "0 of 9 differ from default" when running unchanged settings. The nine filters, grouped as they appear in the filter drawer:
Under TREND: direction (Bullish, Bearish, or Both), ADX Range, and the within 1 ATR of EMA21 toggle (the rubber band rule).
Under PULLBACK: Stochastic %K range.
Under UNIVERSE: Market Cap range and the Include Mega Caps toggle.
Under CONFIRMATION: Weekly Confirmation and Monthly Confirmation toggles.
Under OUTPUT: Results Count (default 30, max 50).
The within-1-ATR toggle deserves a specific note. When it is on (the default), any stock more than one ATR away from EMA21 is filtered out before scoring begins. Turn it off and you see stocks that are in the right trend regime but have not yet pulled back close enough for a tight entry. Useful as a watch list of candidates to monitor.
How the Entry Quality Score is built
Every result that clears the filters gets an Entry Quality Score from 0 to 100. It is a ranking tool, not a prediction. It collapses seven factors into one number so you can compare two setups at a glance instead of mentally juggling six different readings.
Here is exactly how the 100 points are distributed:
| Component | Max Points | What It Measures |
|---|---|---|
| Pullback Depth | 25 | Stoch %K: below 20 = 25, below 30 = 18, at 30-40 = 10 |
| ATR Distance to EMA21 | 20 | Closeness to EMA21: below 0.3x = 20, below 0.5x = 15, below 0.7x = 10, else = 5 |
| Trend Strength | 20 | ADX: 40 or above = 20, 30 to 39 = 15, below 30 = 10 |
| Stoch %K above %D | 10 | Whether %K sits above %D right now (a state, not a fresh cross) |
| RSI Confluence | 10 | RSI 40-55 = 10, RSI 30-40 = 7, RSI 55-65 = 5, else = 0 |
| Relative Volume | 10 | Above 1.5x average = 10, above 1.2x = 7, above 1.0x = 4, below = 0 |
| Momentum Confirmation | 5 | Both 1-month and 3-month performance are positive |
Pullback Depth carries 25 points because it captures how mature the pullback is. Stoch %K at 18 means the short-term oscillator has genuinely washed out. Stoch %K at 36 means the stock barely dipped. The former gives a tight stop reference just below EMA21 with real room for the trade to develop.
ATR Distance is second-heaviest at 20 points. It captures how tight the rubber band is. Within 0.3x ATR of EMA21 is extremely close. Within 0.9x ATR is technically inside the rule but the entry is much looser.
Trend Strength rewards stronger ADX readings. A stock with ADX at 45 has a more reliable trend backdrop than one scraping by at 21.
The Stoch %K above %D term is a 10-point binary. Either the Stochastic %K sits above %D right now or it does not. It is a state, not a fresh cross, so it can have been true for several days; a %K that has turned up through %D out of the oversold zone is the oscillator-level sign that the pullback may be ending.
RSI Confluence rewards RSI between 40 and 55. That zone means RSI has pulled back from overbought without being in distress territory.
Relative Volume adds points for elevated activity during the pullback. Volume above 1.5 times the 10-day average earns the full 10 points.
The 5-point Momentum Confirmation rewards stocks with positive 1-month and 3-month returns, confirming the pullback is happening inside a genuinely upward trend rather than a bounce attempt in a declining stock.
Grades convert the score: A+ at 85 or above, A at 75, B+ at 65, B at 55, C at 45, D below 45.
Key point: Pullback Depth and ATR Distance together account for 45 of the 100 points. A setup that scores high on both has deep-enough washout AND tight proximity to EMA21. That combination is what the screener was built to surface.
Reading the results table
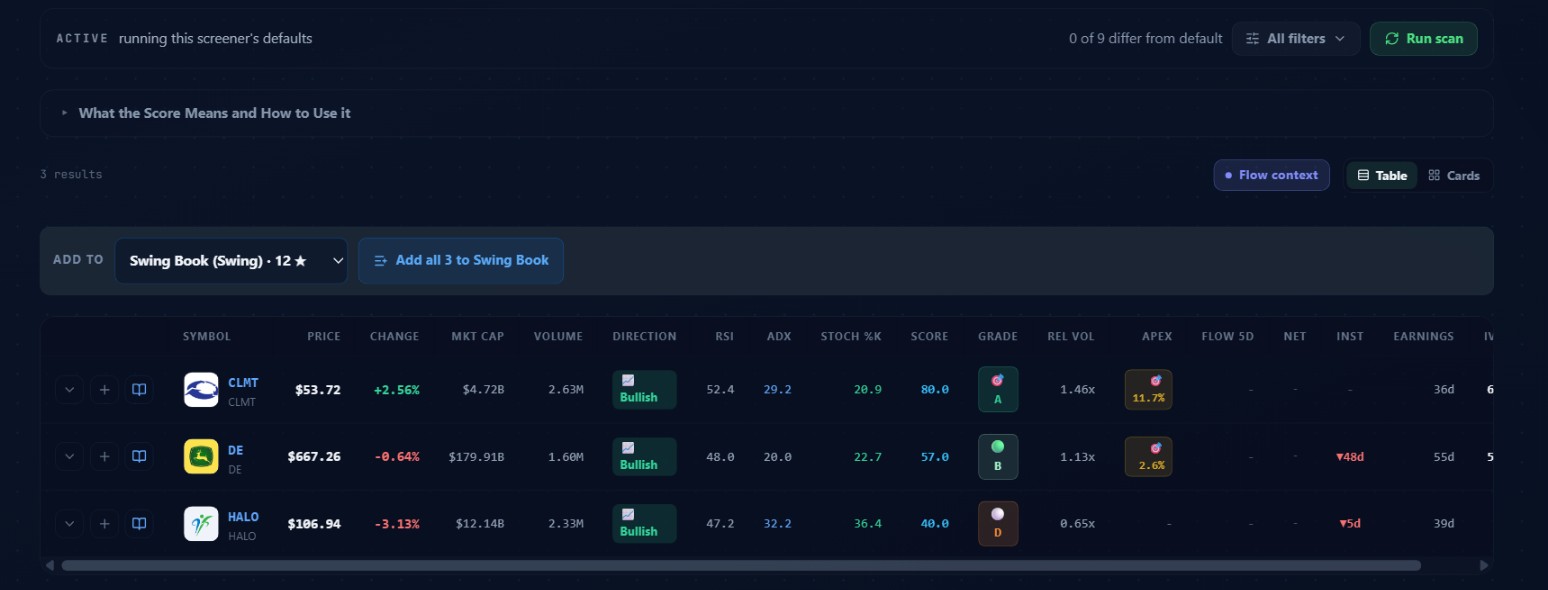 Three results from October 1, 2026. CLMT leads with score 80 and grade A. DE scores 57 for a B. HALO scores 40, a D. All three show Bullish direction.
SYMBOL and PRICE: ticker and last price. Click any row to open the chart view for that stock.
CHANGE: daily percentage change. A negative reading is fine here. The screener finds pullbacks, so a down day is often what you want to see.
MKT CAP and VOLUME: market cap and session share volume.
DIRECTION: Bullish or Bearish, from the direction filter or the Sell the Rip preset.
RSI, ADX, STOCH %K: the three oscillator and trend readings that drove the scoring. RSI is the oscillator zone, ADX is trend strength, Stoch %K is pullback depth.
SCORE and GRADE: the ranking columns. Default sort is Score descending.
REL VOL: today's volume divided by the 10-day average.
APEX: the percentage distance from the current price to the nearest Apex level. Apex levels are gamma-weighted support and resistance points derived from options market dealer positioning. A small APEX distance, say under 3%, means the stock is sitting close to a structural level that options market makers are actively hedging around. Whether it is acting as support or resistance requires looking at the actual level.
FLOW 5D and NET: five-day unusual options flow premium and its net direction. Both require at least $50K in qualifying flow to display anything. A dash means no notable unusual options flow in the prior five sessions. All three rows on October 1 showed dashes.
INST: institutional accumulation streak from ETF and fund holdings data. A downward arrow with a day count means the institutional positioning has been net negative for that many consecutive days. DE showed a negative 48-day streak on October 1. HALO showed a negative 5-day streak. CLMT showed a dash. This is not a filter, just context, but a large negative streak alongside an otherwise clean setup is worth researching before committing.
EARNINGS: days until the next earnings announcement. Pullback entries with short earnings runways carry binary event risk the screener has no way to account for.
IV: implied volatility context, useful when considering whether to express the trade through options.
The three real setups from October 1, 2026
CLMT at $53.72 is the clearest setup of the three, scoring 80 for grade A. Up 2.56% on the day itself, which might sound counterintuitive for a pullback screener, but CLMT had been pulling back in prior sessions and was stabilizing. RSI 52.4 sits in the 40-55 sweet spot (10 points). ADX 29.2 is a confirmed moderate trend (10 points). Stoch %K 20.9 is just above 20, sitting in Moderate pullback territory (18 points). Relative volume 1.46x, above average but below 1.5x (7 points). The Stochastic was crossing back above %D at the time (10 crossover points). ATR distance was below 0.3x of EMA21, the tightest bracket (20 points). Both 1-month and 3-month returns were positive (5 points). Add it up: 18 plus 20 plus 10 plus 10 plus 10 plus 7 plus 5 equals 80.
The Apex distance of 11.7% means the nearest Apex level is far from current price, so there is no immediate structural level directly underneath to anchor a support thesis against. Earnings 36 days out is a clean runway. INST shows a dash.
DE at $667.26 scores 57 for grade B. RSI 48.0 in the pullback zone (10 points). ADX exactly at 20.0, the minimum threshold (10 points). Stoch %K 22.7, Moderate pullback zone (18 points). Relative volume 1.13x (4 points). No Stochastic crossover firing. ATR distance in the 0.3-0.5x range (15 points). That adds to 57.
Two things stand out on DE. The Apex distance of 2.6% means DE was sitting very close to a structural level on October 1, worth investigating before entering. More notable is the INST column showing a negative 48-day streak. That is 48 consecutive days of net negative institutional positioning. The daily setup passes, but that headwind is worth doing more homework on. Earnings 55 days out is clean.
HALO at $106.94 scores 40 for grade D. Down 3.13% on the day. ADX 32.2 is the strongest of the three (15 points). But Stoch %K 36.4 is in Shallow territory, barely below 40 (10 points). Relative volume 0.65x is below average (0 points). ATR distance in the 0.7-1.0x range (5 points). RSI 47.2 in the pullback zone (10 points). No crossover. 10 plus 5 plus 15 plus 0 plus 10 plus 0 equals 40.
HALO passes the regime filters because the daily EMA stack is intact and weekly and monthly confirmation holds. The shallow stochastic means the stock barely pulled back. The below-average volume means there has not been real flushing-out of weak hands. The ATR distance is in the loosest bracket.
The CLMT versus HALO contrast is useful for calibration. CLMT has deep-enough pullback depth, tight proximity to EMA21, a crossover signal, and above-average volume. HALO has the best ADX of the three but earns nothing on pullback depth, volume, and ATR proximity. Same regime, very different entry quality.
Flow context and the Swing Book
The "Flow context" toggle next to the table view enables the FLOW 5D, NET, and INST columns. These are not screener criteria. They are options flow context layered onto each setup. When FLOW 5D shows a number (requires more than $50K in qualifying unusual options flow from the prior five sessions), the options tape has had notable activity on that stock. NET tells you whether that activity leaned bullish or bearish. A name that passes the trend and pullback filters and also shows bullish net flow from the options tape is two independent data sources pointing the same way.
The "ADD TO" control above the table lets you add individual results or all results at once to a watchlist. On October 1 it showed "Swing Book (Swing) · 12" as the target, with "Add all 3 to Swing Book" as the one-click option.
Green flags and red flags
Green flags:
- Score 75 or above, Stoch %K below 20, ATR distance below 0.5x, and a Stoch crossover firing. All four of the highest-weighted scoring factors aligned.
- FLOW 5D and NET showing bullish options flow. Options positioning agreeing with the equity technicals is multi-source convergence worth acting on.
- Earnings 20 or more days out. Pullback entries with earnings proximity carry binary event risk.
Red flags:
- A large negative INST streak. DE's 48-day reading on October 1 is the kind of headwind worth researching before committing to a swing trade.
- Grade C or D. The regime requirements passed but multiple scoring components are soft simultaneously.
- Stoch %K between 35 and 40. Technically inside the filter but at the shallowest end. The rubber band barely has any stretch.
- Earnings within two weeks. At that point the setup is closer to a binary event play than a trend continuation.
Watch out: A large negative INST streak doesn't automatically kill the setup, but a streak like DE's 48-day reading is a research flag. What is driving 48 consecutive days of institutional outflows on a name that otherwise passes the trend and pullback filters?
Common mistakes
-
Treating a grade A result as an automatic entry. The screener confirms the trend backdrop and the pullback zone. It does not confirm the pullback is finished. A stock can be at EMA21 in a perfect five-EMA stack and break right through it if buyers do not show up.
-
Running Standard mode and Bullish Pullback side by side and comparing scores directly. A score of 70 under Standard, which required monthly confirmation, reflects different conditions than a score of 70 under Bullish Pullback, which did not.
-
Dismissing the INST column because it is not a hard filter. The institutional data covers a long enough lookback that a sustained negative streak reflects actual positioning. Treat it as a research prompt rather than a red X.
-
Ignoring Earnings. Pullback entries within two weeks of earnings are a different kind of trade. The screener has no way to account for the binary event; you have to.
How this screener fits with the others
This screener finds stocks in established uptrends resting before a potential continuation. The Breakout scanner finds stocks breaking through levels. These two screens cover different stages of the same trend cycle: Breakout catches the initial break, Momentum Pullback catches the first real dip after the trend is established.
The Reversal Finder looks for beaten-down stocks with capitulation signals. Many of those names do not have an intact EMA stack at all. That is a different kind of trade, buying distress rather than a healthy pause in an uptrend.
For flow confirmation on names from this screener, Unusual Activity shows individual options prints scored by the anomaly engine. A name passing Momentum Pullback that also shows up on Unusual Activity with repeat bullish sweeps has two independent inputs pointing the same direction. Live Flow rolls up the $20K-plus options tape per ticker: total premium, bull/bear split, the biggest recent print. A lopsided bullish card there alongside a passing setup here is worth acting on.
For the options market structure underneath a specific setup, GEX shows dealer gamma exposure and what levels matter to market makers. The APEX column in the results table is a quick read from that same gamma data, but GEX gives the full picture.
Sector Flow shows where institutional options premium is going by sector. If Momentum Pullback is surfacing names in Financials and Sector Flow is also showing heavy bullish Financials premium, that sector-level agreement is worth noting.
A routine
Try this: After the close, run Standard mode at defaults. For each result at score 75 or above: check Earnings first (want 15 or more days out), then INST (want neutral or no large negative streak), then APEX distance (if under 5%, look at what that level actually is before deciding it is support).
Then open Unusual Activity and search for the same names. Has the options tape had notable activity in the past five sessions? If the screener setup and the options flow agree, that is a higher-conviction situation than either one alone.
If Standard returns nothing, switch to Bullish Pullback. Treat those results with slightly more scrutiny, since the monthly timeframe has not weighed in.
Check back the next session. The Stochastic reading that was at 22 can be at 45 after a strong open.
Options trading involves real risk of loss and is not appropriate for everyone. The Entry Quality Score ranks setups by quantitative criteria but does not predict future price. Nothing here constitutes financial advice.