Loading...

Markets & Smart Money deep dive · 14 min read
How to Read Market Health
A first-person walkthrough of every section on the Market Health page: the cross-asset strip, nine signal cards, the composite scoring math, the S&P 500 valuation framework, and how to change your position sizing based on what you see.
Open the tool →Hey guys, Art from TraderMatrix here. The page I want to walk through is Market Health, found under Markets & Smart Money in the nav. It lives at /market-health and I look at it every morning before I check a single flow card. Before I sort through Unusual Activity, before I open GEX, before I look at a chart. This guide goes through every section on the page, how the scoring works under the hood, and how I actually use the composite number to change how I size positions.
The short version:
- Market Health runs five scored stress tests across credit, risk appetite, volatility, and rotation. Four more signals sit alongside as context.
- Each scored ALERT adds 1 point to the composite; each WATCH adds 0.5. LOW is under 2 points, ELEVATED is 2 to 2.5, HIGH is 3 or more.
- The composite changes one thing: how big you trade. It does not tell you which direction.
- An UNAVAILABLE signal adds 0 points and is excluded from the denominator. Check how many scored signals have data before trusting a LOW read.
- The composite cutoffs came from a 2011 to 2026 backtest. They are provisional; treat them that way.
What this page is and what it isn't
A lot of people open Market Health expecting a dashboard that tells them whether to buy or sell today. That is not what the page does.
Market Health tests whether the macro conditions surrounding the market are stressed or calm. It tracks credit, volatility structure, risk appetite, and sector rotation across five independently scored signals, then combines their readings into a composite score. That composite has three bands: LOW, ELEVATED, and HIGH. Each band maps to a sizing decision, not a direction call.
HIGH does not mean short the market. ELEVATED does not mean buy puts. The composite tells you how much risk to carry right now, and nothing else. In a HIGH environment you trade smaller in both directions. In a LOW environment you trade your normal size. The actual direction of your trades comes from everything else on the platform: the flow pages, the GEX regime, the scanners.
There are also four context signals on the page that are shown alongside the scored ones but do not move the composite. They went through the same 2011 to 2026 backtest and did not improve the risk score's ability to read forward drawdowns. They are worth looking at, but they do not change the number.
One more thing worth naming before the tour: there is a separate valuation framework on the page that models the S&P 500's fair value from earnings, growth, and Treasury yields, and it has an implied risk premium gauge. That section is independent of the stress-signal composite. It answers a different question entirely, not "is stress elevated?" but "is the index priced appropriately for that stress?"
The top of the page: the cross-asset strip
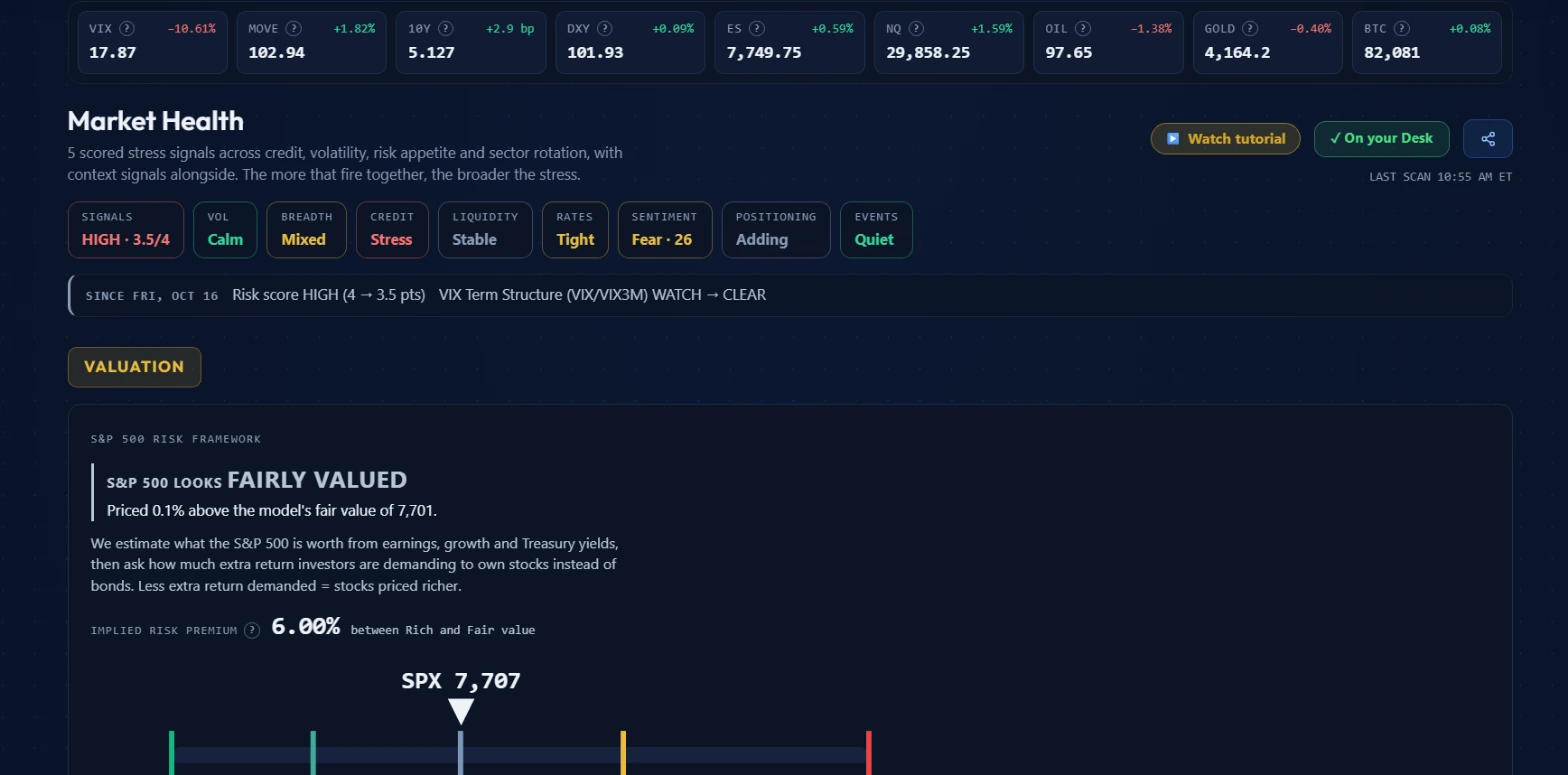 The cross-asset strip across the top, signal summary pills below it, the "since" strip showing recent changes, and the S&P 500 valuation framework.
The very top of the page is a strip of nine cross-asset indicators. On October 19, 2026 at 10:55 AM ET it showed: VIX at 17.87 (down 10.61%), MOVE at 102.94 (up 1.82%), the 10Y yield at 5.127% (up 2.9 basis points), DXY at 101.93 (up 0.09%), ES futures at 7,749.75 (up 0.59%), NQ futures at 29,858.25 (up 1.59%), OIL at 97.65 (down 1.38%), GOLD at 4,164.2 (down 0.40%), and BTC at 82,081 (up 0.08%).
Each tile shows the current value and its daily change. The strip is a quick read of what markets are doing across asset classes before you look at any signal.
The VIX at 17.87 and down over 10% is meaningful context: equity implied volatility was falling, which typically reflects calmer near-term conditions. Compare that to the MOVE index at 102.94 and rising. Bond market volatility was climbing while equity vol dropped, a mild divergence between the two markets. The 10Y yield at 5.127% feeds directly into the valuation framework below, which I will get to in a moment.
The signal summary pills
Below the strip is a row of pills summarizing different dimensions of current market conditions. On October 19 they read:
SIGNALS HIGH · 3.5/4 is the composite regime score. HIGH means the composite has crossed the 3.0-point threshold. The 3.5 is the current score; the /4 is the maximum achievable given how many scored signals have data that session. When Junk Credit Spreads had no data on October 19, the system excluded it from both the numerator and the denominator, shifting the max from 5 to 4 possible points.
VOL Calm reflects the volatility environment. VIX was dropping that morning.
BREADTH Mixed summarizes whether the broad market is keeping up with the major indices.
CREDIT Stress means the credit signals are firing, consistent with two scored credit signals at ALERT.
LIQUIDITY Stable says financial conditions are not showing significant tightening.
RATES Tight reflects interest rate conditions, consistent with a 5.127% 10Y yield.
SENTIMENT Fear · 26 is a sentiment gauge in fear territory.
POSITIONING Adding summarizes net market positioning direction.
EVENTS Quiet means no significant economic events are imminent.
These pills give you the big-picture read in a single glance. The SIGNALS pill is the one that drives sizing decisions. Everything else is color around it.
The "since" strip
Below the pills is a line showing the most notable changes since the prior checkpoint. On October 19 it read: "SINCE FRI, OCT 16 Risk score HIGH (4 → 3.5 pts) VIX Term Structure (VIX/VIX3M) WATCH → CLEAR."
The strip tracks what changed between the last notable baseline reading and now. Between Friday October 16's close and the October 19 morning reading, the VIX term structure signal moved from WATCH to CLEAR, losing 0.5 points and bringing the composite from 4.0 down to 3.5. The overall regime label stayed HIGH both times, since both 3.5 and 4.0 clear the 3.0-point threshold.
This strip is what I check when I already know the composite label from a prior session. Instead of re-reading the entire signal map, the "since" line tells me what moved and in which direction. A change that shifts the label (say, ELEVATED flipping to HIGH) is the one that changes my sizing plan. A change that keeps the label the same at a different score gives directional information without requiring immediate action.
The S&P 500 valuation framework
Below the "since" strip is the VALUATION section with the S&P 500 Risk Framework.
On October 19 it read: "S&P 500 LOOKS FAIRLY VALUED. Priced 0.1% above the model's fair value of 7,701." The implied risk premium showed 6.00%, positioned between the Rich and Fair value bands on the bar. SPX was trading at 7,707, very close to the fair value marker.
The model estimates what the S&P 500 is worth from earnings, growth, and Treasury yields, then calculates how much extra return investors are demanding to own stocks instead of bonds. That extra return is the implied risk premium. Lower premium demanded means stocks are priced richer. Higher premium demanded means they look cheaper. The horizontal bar shows the current SPX price relative to colored zones ranging from cheap through fair value to rich.
The data footer notes the model's input dates and adds "model, not a forecast," which is the right framing for this section.
I use this section as context, not a trade signal. On a day where the composite is HIGH and the index is in the rich zone, both the stress signals and the valuation are pointing the same direction: carry less. On a day where the composite is LOW and the index is in the cheap zone, you have room to run your normal plan. The two sections answer different questions, and reading them together takes about thirty seconds.
The risk score gauge, breadth panel, and signal map
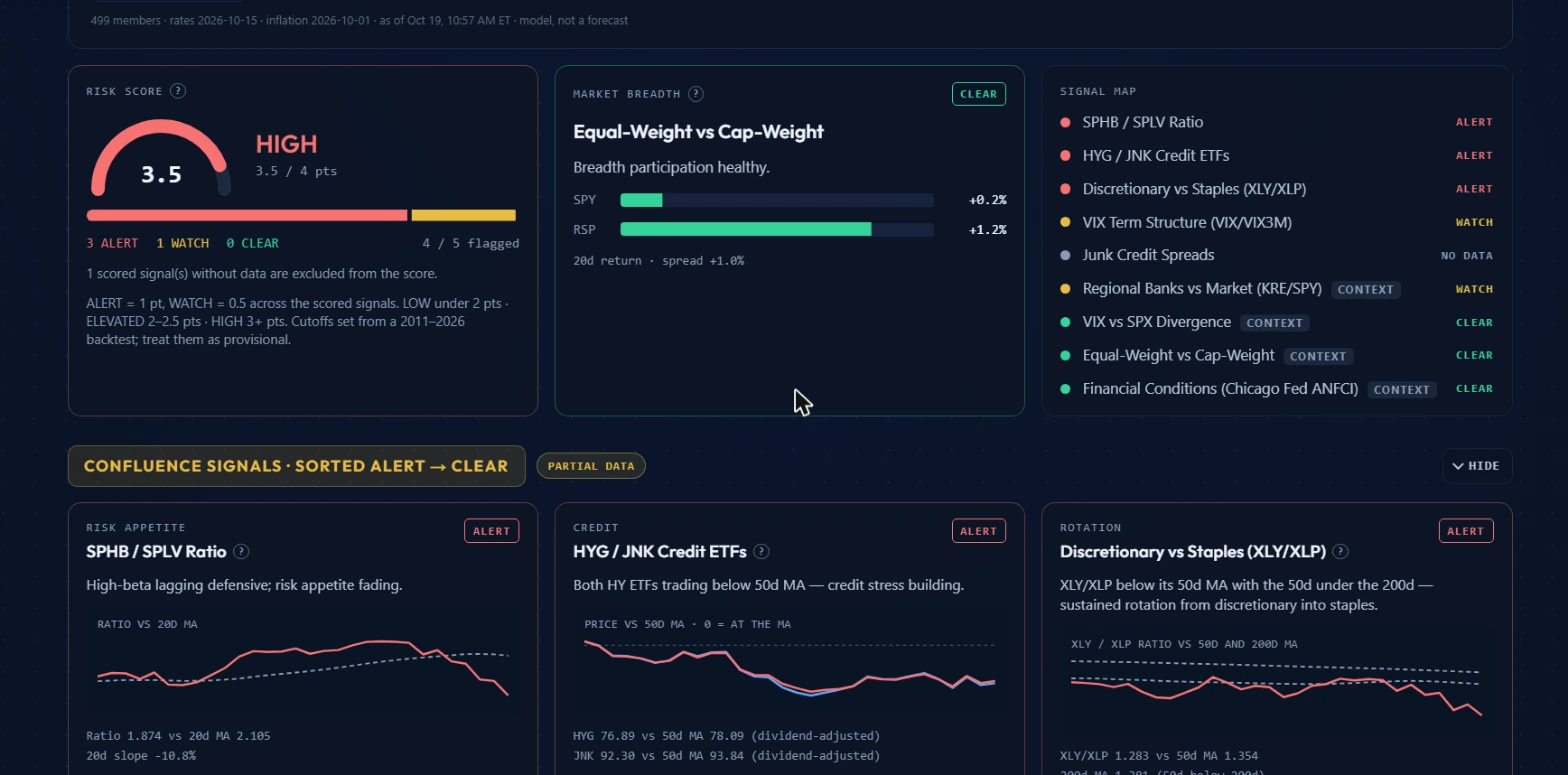 Left: the risk score gauge showing HIGH 3.5 pts out of a possible 4, with 3 ALERT and 1 WATCH. Center: equal-weight vs cap-weight breadth showing CLEAR. Right: the full signal map.
This section is the core of the page. Three panels sit side by side.
The risk score gauge shows the composite numerically. On October 19: HIGH 3.5 / 4 pts, with 3 ALERT, 1 WATCH, 0 CLEAR, and 4/5 flagged. The note below the gauge reads: "1 scored signal(s) without data are excluded from the score. ALERT = 1 pt, WATCH = 0.5 across the scored signals. LOW under 2 pts. ELEVATED 2-2.5 pts. HIGH 3+ pts. Cutoffs set from a 2011-2026 backtest; treat them as provisional."
Every number you need is on this panel. The gauge tells you the label. The breakdown tells you which signals are driving it. The note tells you to check for data gaps before trusting the number.
The market breadth panel sits in the center. On October 19 it showed "Equal-Weight vs Cap-Weight. Breadth participation healthy." SPY was up 0.2% and RSP was up 1.2% over the prior 20 days, with a spread of +1.0%. The status badge showed CLEAR.
RSP is the equal-weight S&P 500 ETF. When it keeps pace with or outperforms SPY (the cap-weight version), the rally is broad, with many stocks participating rather than a handful of mega-caps doing the work. On October 19 the spread was positive: breadth was healthy.
The signal map on the right lists every signal with its current status. On October 19:
Scored signals:
- SPHB / SPLV Ratio: ALERT
- HYG / JNK Credit ETFs: ALERT
- Discretionary vs Staples (XLY/XLP): ALERT
- VIX Term Structure (VIX/VIX3M): WATCH
- Junk Credit Spreads: NO DATA
Context signals:
- Regional Banks vs Market (KRE/SPY): CONTEXT, WATCH
- VIX vs SPX Divergence: CONTEXT, CLEAR
- Equal-Weight vs Cap-Weight: CONTEXT, CLEAR
- Financial Conditions (Chicago Fed ANFCI): CONTEXT, CLEAR
Three scored ALERT signals at 1 point each, one WATCH at 0.5, one with no data. Total: 3.5 points. HIGH.
What each scored signal measures
Below the three-panel section, the page shows individual confluence signal cards, one per signal, each with a sparkline showing the raw data over time.
SPHB / SPLV Ratio (RISK APPETITE): This compares high-beta stocks (SPHB) against low-volatility stocks (SPLV). When the ratio falls, defensive low-vol names are outperforming aggressive high-beta ones. Markets are paying up for safety. On October 19 the ratio was 1.874 vs a 20-day moving average of 2.105, with a 20-day slope of negative 10.8%. The ratio had been trending down meaningfully, which triggered ALERT: "High-beta lagging defensive; risk appetite fading."
HYG / JNK Credit ETFs (CREDIT): These are the two major high-yield bond ETFs. When they trade below their 50-day moving averages, the credit market is pricing in more risk. Junk bond prices are falling relative to trend, meaning investors are demanding more yield spread over Treasuries. On October 19, HYG was at 76.89 vs a 50-day MA of 78.09, and JNK was at 92.30 vs a 50-day MA of 93.84 (both dividend-adjusted). Both below their 50-day averages, triggering ALERT: "Both HY ETFs trading below 50d MA. Credit stress building."
Junk Credit Spreads (CREDIT): A separate credit signal that tracks the actual yield spread between junk bonds and comparable Treasuries. When spreads widen, risk premiums are rising. On October 19 this signal had NO DATA and contributed 0 points.
VIX Term Structure, VIX/VIX3M (VOL REGIME): VIX measures near-term S&P 500 implied volatility (roughly 30 days). VIX3M measures the same thing at 90 days. When the ratio of VIX to VIX3M rises above 1.0, near-term fear is priced higher than longer-term fear. Markets are pricing a short-term risk event more severely than longer-term uncertainty. That inversion of the normal term structure is the signal. On October 19 it was at WATCH.
Discretionary vs Staples, XLY/XLP (ROTATION): XLY is the consumer discretionary ETF; XLP is consumer staples. When the ratio falls below its 50-day moving average, and especially when the 50-day drops below the 200-day, it indicates sustained defensive rotation rather than a brief dip. On October 19: XLY/XLP ratio at 1.283 vs 50-day MA of 1.354, and the 200-day MA at 1.301. The 50-day was below the 200-day. ALERT: "XLY/XLP below its 50d MA with the 50d under the 200d. Sustained rotation from discretionary into staples."
What the context signals add
The four context signals are visible on the page but carry no points in the composite.
VIX vs SPX Divergence tracks whether VIX is rising while the S&P 500 is flat or falling, a sign that the market is pricing in a risk event through volatility even as price holds. CLEAR on October 19.
Equal-Weight vs Cap-Weight (RSP/SPY) is the breadth signal described above. CLEAR on October 19.
Financial Conditions (Chicago Fed ANFCI) uses the Chicago Federal Reserve's National Financial Conditions Index. A tighter reading means borrowing conditions are more restrictive across the economy. CLEAR on October 19.
Regional Banks vs Market (KRE/SPY) compares regional bank stocks to the broad market. Regional banks are sensitive to deposit conditions and hold a significant share of commercial real estate loans, making them a useful early signal for credit stress. WATCH on October 19.
These signals did not improve the composite's predictive ability in the backtest, which is why they are context-only. But a context signal at ALERT (particularly KRE/SPY or ANFCI) while the composite sits at LOW is still worth noting. The scored set is not necessarily capturing everything.
Two workflows
Entering a trade when the composite is HIGH
It is Thursday morning, October 19, 2026. The composite is HIGH at 3.5 points. You have spotted a name from the flow pages with a strong bullish lean. Under normal conditions your plan is to size this trade at 4 contracts, roughly $800 in total debit.
With a HIGH composite, I cut to 2 contracts. The trade plan is otherwise unchanged: same strike, same expiry, same target. I just carry half the size until the composite comes back to ELEVATED or LOW.
The composite is not telling me the trade is wrong. It is telling me the environment is stressed enough that I should not be at maximum exposure. If the trade works, I collect half what I would have at full size. If it fails, I lose half. Three separate signals at ALERT simultaneously is not the moment to swing full size.
Watching the composite climb from LOW to ELEVATED over several sessions
Early in the week the composite is LOW at 1.0 point. Only the HYG/JNK credit ETFs are at WATCH, contributing 0.5 points. You have several positions open at full size.
Tuesday night HYG/JNK moves from WATCH to ALERT, adding 0.5 points. The SPHB/SPLV ratio slips to WATCH, adding another 0.5 points. The composite is now at 2.0 points: ELEVATED.
I do not immediately exit open positions. I check the "since" strip the next morning. If the composite has held at ELEVATED, my rule is: any new entry I make goes on at half size. For positions already on from the LOW period, I tighten stops by half the normal distance. This is not a wholesale exit. It is a tighter leash on new risk until conditions ease.
If the composite keeps climbing over two or three more sessions toward HIGH, I start trimming existing positions one at a time, starting with the highest-risk ones.
Where Market Health fits with the other tools
| Tool | What it answers | Pair with Market Health when |
|---|---|---|
| Futures GEX | Dealer gamma structure and key levels | HIGH composite plus a negative GEX regime means both macro stress and gamma amplification are elevated at once |
| Unusual Activity | Individual scored options prints | During ELEVATED or HIGH, filter by score 90 or above and large premium to find conviction flow despite the regime |
| Sector Flow | Options premium split by sector | Credit signals at ALERT often coincide with sector rotation; Sector Flow tells you which sectors are seeing defensive positioning |
| Flow Heat Map | Broadest options premium picture across tickers | During HIGH composite, the Heat Map's sustained bearish lean across multiple sectors confirms or contradicts what the credit signals are showing |
| LEAPS Scanner | Long-dated options setups | In a risk-off regime, LEAPS on high-delta names with defined risk keep directional exposure without oversizing |
Common mistakes
Treating HIGH as a direction signal
HIGH does not mean short the market. On October 19 the composite was HIGH at 3.5 points, but the signal pills showed VOL as Calm and the index was trading near fair value. Multiple things were simultaneously true: credit stress was elevated, but equity conditions were not in freefall. Shorting into that environment based solely on a HIGH composite means fighting a market still printing gains, just with reduced size.
Ignoring UNAVAILABLE and NO DATA signals
An UNAVAILABLE signal contributes 0 points and is excluded from the max. A LOW composite with two scored signals missing data could be underreporting actual stress. On October 19, Junk Credit Spreads had NO DATA. The composite showed 3.5 out of a possible 4, not 5. If that signal had been available and fired at ALERT, the score would have been 4.5, still HIGH but at a higher absolute level. Before trusting a LOW read, check whether multiple scored signals are showing NO DATA or UNAVAILABLE.
Checking it once a day
Signals can shift mid-session. Credit readings and volatility term structure can move significantly in a single afternoon. The "since" strip shows recent changes relative to a prior checkpoint. For swing trading, a morning check is usually sufficient. For intraday entries, a quick glance at the pills mid-session takes five seconds and can catch a regime change you would otherwise miss.
Conflating the GEX regime and Put/Call panels with the composite
The page has additional structural panels alongside the scored signals, including a GEX regime card and a Put/Call card. These are independent of the composite. The GEX card reads dealer gamma positioning from the options market structure. The Put/Call card tracks the ratio across the tape. Both are useful, but they answer different questions from the credit and vol signals. A positive GEX regime and a HIGH composite can and do sit alongside each other. Read each panel for what it is.
Treating WATCH as noise
A single WATCH signal might be noise. Two WATCH signals in different categories climbing in the same week is a regime change in the making. A composite moving from 0.5 to 1.0 to 1.5 over three consecutive sessions is a slower-moving but real signal. The raw values on each signal card tell you whether the stress is accelerating or stalling. Accelerating toward ALERT is the one to act on early. Stalling at WATCH without crossing over is a reason to watch and wait.
What the tool does not tell you
Market Health is a model of current macro stress conditions. It is not a forecast of market direction.
The 2011 to 2026 backtest from which the cutoffs came found that HIGH readings correlated with higher rates of forward drawdowns, but the composite page itself says to treat those cutoffs as provisional. The tool is reactive, not predictive. By the time the composite reaches HIGH, the credit stress and vol inversion that triggered it have already been developing for some time. Its value is in keeping you from carrying maximum exposure while conditions are already stressed, not in front-running stress before prices move.
Some signals can also diverge from what the composite captures. On October 19, the KRE/SPY context signal was at WATCH while financial conditions and breadth were both CLEAR. That divergence is worth noting even though neither signal moves the number. Context signals staying in your peripheral vision matters.
For a different kind of forward-looking read, pair this page with the flow tools. High-conviction options positioning at unusual scale is a separate signal from what Market Health measures, and the two can point in different directions at the same time. Both are real information about what is happening in the market, just through different lenses.
Options trading involves real risk of loss, including potentially more than the amount you invest. Nothing here is financial advice; it is an explanation of how the tools work and how to read the data they surface. The composite cutoffs described are provisional and derived from a historical backtest. Past patterns of signals preceding market stress are not a guarantee of future behavior. Manage your position sizing according to your own risk tolerance.