Loading...

Options Screeners deep dive · 17 min read
How to Use the 2x Leveraged ETF Screener
A deep-dive into the 2x Leveraged ETF screener: how daily rebalancing creates decay and compounding, what Trending, Ignition, and Gap modes detect, how EdgeScore ranks setups, and how to read the ETF map when the recommended instrument shows N/A.
Open the tool →Hey guys, Art from TraderMatrix here. Most traders who start using 2x leveraged ETFs have the same experience: they watch a name move 3% in their direction, check the fund, and see it up maybe 4.7%. Not 6%. They assume it's a data lag or a pricing quirk. A few weeks later, they realize the drift is structural and runs in both directions.
The "2x" in the fund name refers to the daily return. Not the return over a week, not the month, not the position duration. Each individual session. That distinction is the entire story of these instruments, and if you don't start there, the screener is going to confuse you.
The short version:
- The "2x" is a single-day target, reset every night. In choppy conditions it creates decay. In a trending market it compounds gains faster than the underlying.
- The screener runs three detection modes simultaneously: Trending, Ignition, and Gap. EdgeScore blends the top two results per name.
- Check the ETF column before anything else. N/A means no 2x vehicle exists for that setup, regardless of how strong the score is.
- All signal detection runs on the underlying stock, not the fund. The fund is the instrument; the underlying is where the setup lives.
- Ignition catches moves before ADX confirms. Trending catches confirmed moves. Gap works from overnight and premarket data.
What daily rebalancing actually does
A 2x leveraged ETF aims to deliver twice the underlying stock's single-day return. Fund managers reset the portfolio every night at the close to restore that 2x exposure for the next session. The math that makes this work also creates a compounding effect that runs against you when the underlying isn't trending.
Here is what that looks like in practice. A stock closes up 5% on Monday and down 5% on Tuesday. You started at $100. Monday close: $105. Tuesday close: $99.75. The stock isn't back to $100 because percentage moves are asymmetric. Equal-percentage opposing moves don't net to zero.
A 2x ETF amplifies the same effect. Monday: +10%, so $110. Tuesday: -10%, so $99. The underlying is down 0.25% and the ETF is down 1%. That 0.75% gap is decay, and it compounds across every choppy session. Over a long enough period of going nowhere, the fund drifts lower even though the underlying ends flat.
There is a flip side that matters just as much. In a strongly trending market the compounding works in your favor. If a stock gains 5% across four consecutive sessions, the 2x ETF doesn't just gain twice the total return, it gains more, because each day's gains compound from a higher base. The asymmetry that hurts in choppy conditions accelerates gains in trending ones.
This is why the screener is designed specifically around trending setups. The three detection modes it runs simultaneously all target conditions where the underlying has directional momentum. That is not a coincidence. It is the only mathematical environment where the daily reset works for you instead of against you.
Key point: Decay accumulates across every choppy session. The screener's three modes all target trending conditions because that is the only environment where daily rebalancing works in your favor instead of against you.
The other thing worth knowing before looking at any results: tracking error means the fund's actual daily return usually deviates from the theoretical 2x. Spreads, rebalancing costs, and the timing of the fund's own hedging trades all introduce small differences. On a 5% underlying day, a 2x fund might close at +9.1% or +10.3% depending on intraday conditions. The screener uses the underlying's signal to detect the setup, so it isn't affected by this, but the fund's performance on any single day is an approximation, not a guarantee of exactly 2x.
Bull ETFs, bear ETFs, and the map
Each underlying stock in the screener maps to a 2x bull ETF and sometimes to a 2x bear ETF. The bear side is the 2x inverse: if the underlying drops 3%, the bear ETF aims for roughly +6%.
The word sometimes matters. A meaningful portion of the mapped underlyings have no 2x inverse fund listed. Product issuers have launched bull ETFs on a wide range of single stocks because retail demand for the long side is larger. The inverse side exists on a much smaller subset. TSLA maps to TSLL for bull and TSDD for bear. MU maps to MUU for bull and MUZ for bear. NVDA has multiple bull options including NVDU and NVDL, and bear options including NVD. META maps to METU for bull but has no listed 2x inverse fund. COHR, LITE, APP, PONY, and DJT all have bull ETFs but no mapped bear ETF.
When the screener detects a bearish trending setup on one of these names, the recommended ETF column shows "N/A (no bear ETF)" and that is the complete answer. There is no vehicle available for a 2x short expression on that name within the screener's universe.
Watch out: N/A in the ETF column is the complete answer, not a data gap. No 2x inverse fund exists for that name. The setup score is still real; there is just no listed vehicle to express it with leverage.
Why the asymmetry? Product issuers weigh expected trading volume, and short-side single-stock leveraged funds have historically attracted less consistent retail flow than bull-side ones. Some inverse funds that were launched have also been closed due to low assets under management, so the bear-side map reflects products that are actually liquid enough to appear in a screener. The gap is real and it is larger on some names than others.
The three detection modes
The screener runs three setup types simultaneously. Every result in the table is scored against all three, and the final EdgeScore blends the top two.
Trending mode catches confirmed directional moves. The 1-hour ADX has to be at least 25, or at least 20 on the 1H with the 15-minute ADX at 25 or above to compensate. Relative volume has to be at least 1.2 times the 10-day average. The price has to be on the correct side of the 15-minute EMA21: above it for a bullish setup, below it for a bearish one. When all of that passes, the mode scores ADX strength, volume intensity, RSI in the healthy momentum range (45 to 80 for bull, 20 to 55 for bear), and MACD alignment with the trend direction. If all three timeframes, the daily, 1H, and 15M, agree on direction, another 10 points get added.
Ignition mode targets the earlier stage of a move, before ADX has fully confirmed the trend. It looks specifically for conditions where 15-minute momentum is building faster than the 1-hour baseline has moved. The 15-minute ADX has to be between 10 and 25 and expanding by at least 5 points above the 1H ADX reading. Relative volume must be at least 1.5 times the average. The 15-minute RSI has to sit in the ignition range: 50 to 68 for a bullish setup or 32 to 50 for bearish. That specific RSI band is deliberate. Momentum has moved enough to confirm direction but hasn't overheated yet. MACD alignment on the 15-minute timeframe adds another 20 points to the ignition score.
Gap mode works from overnight or premarket moves. The gap or premarket change must be at least 2% in either direction with relative volume at or above 1.2 times the average. Continuation gets rewarded: 10 points if the direction from open is still consistent with the gap, and up to 15 more if VWAP agrees with that direction.
Before any mode scoring starts, two hard filters apply to every row. ATR in dollars must be at least $0.30 AND at least 1.5% of the stock's price. That second condition matters more than the dollar floor. A $500 stock with $1 ATR has only 0.2% daily range, which gives a leveraged fund nothing meaningful to amplify. The percentage floor ensures there is enough intraday movement for leverage to be useful rather than just adding exposure to noise.
EdgeScore: how the ranking works
EdgeScore runs from 0 to 100. The formula: take the highest raw mode score across all three modes, add 40% of the second highest, round to the nearest whole number.
If the underlying's 1-hour return is outperforming SPY by more than 0.5 percentage points in the direction of the trend, 10 more points get added. That relative strength bonus separates a name whose move is company-specific from one that is just tracking the broader market. A stock up 3% on a day when SPY is also up 2.5% isn't doing anything distinctive. A stock up 3% when SPY is flat is a different situation, and the score reflects that.
The default EdgeScore floor is 15. Anything below that doesn't appear in results. Results sort by EdgeScore descending.
Key point: EdgeScore = best mode score + 40% of second-best mode score. If the name is outperforming SPY by more than 0.5 percentage points in the trend direction, 10 bonus points are added. That relative strength bonus is the separator between a company-specific move and a market drift.
The page, from top to bottom
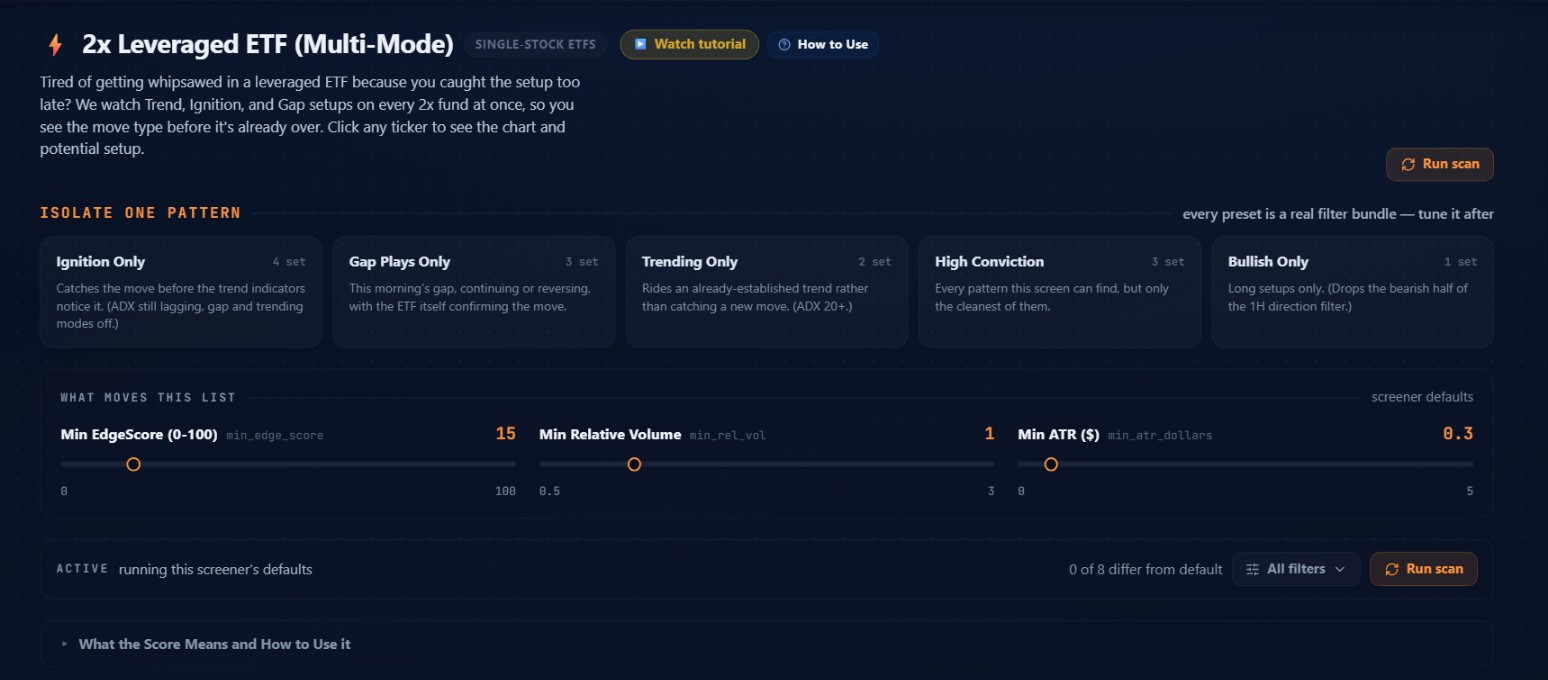 The screener header, "ISOLATE ONE PATTERN" preset cards, "WHAT MOVES THIS LIST" sliders, and the ACTIVE chip row on October 1, 2026. Eleven results found with default parameters.
The page opens with "2x Leveraged ETF (Multi-Mode)" and a "SINGLE-STOCK ETFS" tag. The description explains what the screener was built to solve: getting whipsawed in a leveraged fund because the entry came too late into the move. Running three pattern types simultaneously means you can see which mode fired and how strong the setup is before the move has already run.
"Watch tutorial" and "How to Use" sit in the top right. Export downloads the current results as CSV.
Below the header are the preset cards under "ISOLATE ONE PATTERN." Each preset sets multiple filter parameters at once. The note reads "every preset is a real filter bundle, tune it after" meaning you can load a preset and then adjust sliders from that starting state.
- Ignition Only (4 set): disables gap and trending modes, raises the EdgeScore floor to 25, and sets minimum relative volume to 1.5x. These are the earliest-stage setups, where ADX is still building but short-timeframe momentum is starting to accelerate.
- Gap Plays Only (3 set): disables ignition and trending modes, sets EdgeScore floor to 20. Results show only names with significant overnight or premarket gaps and at least some continuation evidence.
- Trending Only (2 set): disables ignition and gap modes. All results will have ADX above threshold and price on the correct side of EMA21.
- High Conviction (3 set): keeps all three modes active but raises EdgeScore to 40, minimum relative volume to 1.5x, and minimum ATR to $0.60. Shorter list, stricter requirements across the board.
- Bullish Only (1 set): drops bearish setups. Every result will have a named bull ETF in the recommendation column rather than N/A.
The three sliders below the presets control the screener-level pre-filter. Min EdgeScore (default 15) is the floor below which rows are dropped. Min Relative Volume (default 1.0) is a screener-level minimum on top of the per-mode thresholds. Note that Trending mode internally requires 1.2x and Ignition mode requires 1.5x regardless of this slider's position. Min ATR in dollars (default $0.30) filters out names without enough intraday range.
The ACTIVE chip row shows the current filter state. On October 1 it read "running this screener's defaults" with "0 of 8 differ from default." When parameters change, the chip updates to show how many have been adjusted. The "ADD TO" list picker offered "Add all 11 to Swing Book" on that session, writing the full result set to a watchlist in one step.
The results table
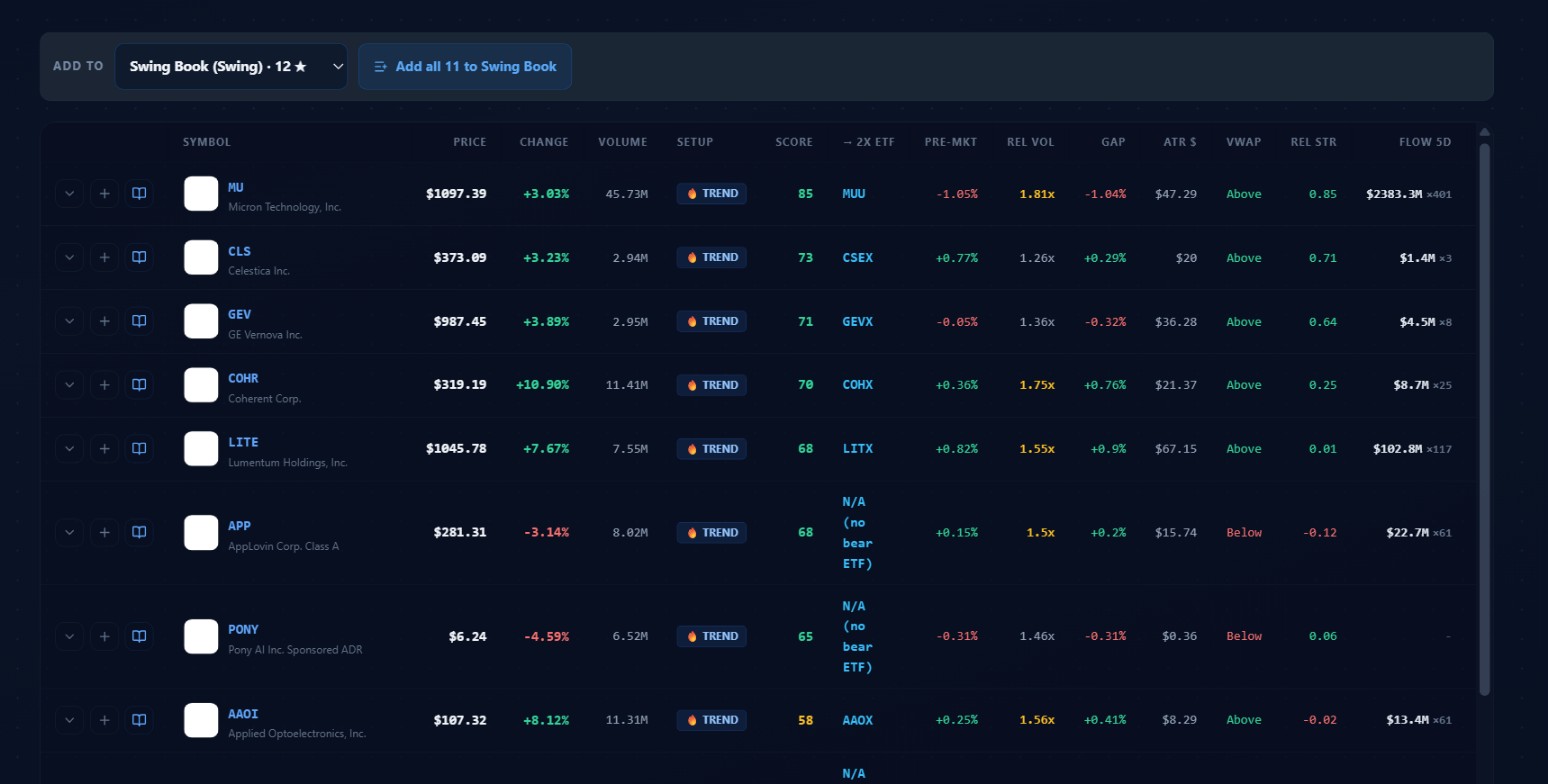 Results sorted by EdgeScore descending on October 1, 2026. MU led at 85. APP and PONY show N/A because they were bearish trending setups with no mapped 2x inverse ETF.
SYMBOL is the underlying stock. All signal detection runs on this name, not the fund.
PRICE and CHANGE are the current price and day's percentage change on the underlying. On October 1: COHR was up +10.90%, AAOI up +8.12%, LITE up +7.67%. The session was concentrated in optics and semiconductor names.
VOLUME is share volume on the underlying.
SETUP is the mode badge: TREND, IGNITE, or GAP. Every result on October 1 showed TREND. In a session where Gap mode dominates, the table looks different, with GAP badges and typically heavier premarket readings.
SCORE is EdgeScore. MU at 85 led the October 1 table with a clear margin ahead of the next cluster: CLS at 73, GEV at 71, COHR at 70, then LITE and APP at 68, PONY at 65, and AAOI at 58. The gap between 85 and the next group reflects how strongly MU was trending across all three timeframes.
-> 2X ETF is the recommended fund, resolved from the 1H trend direction. All six bullish setups on October 1 showed named ETFs: MUU for MU, CSEX for CLS, GEVX for GEV, COHX for COHR, LITX for LITE, AAOX for AAOI. APP at -3.14% and PONY at -4.59% were bearish trending setups. Neither has a mapped 2x inverse fund, so both showed "N/A (no bear ETF)."
The remaining columns fill out the picture with the supporting evidence for each setup. PRE-MKT shows the premarket percentage change. REL VOL is current session volume divided by the 10-day average: MU at 1.8x, COHR at 1.75x, LITE at 1.55x. GAP is the overnight gap percentage: MU gapped slightly down at -1.04% but trended strongly intraday, COHR gapped up +0.76%, LITE up +0.9%. ATR $ is Average True Range in dollars: MU at $47.29 on a $1,097 stock is 4.3% ATR, well above the percentage floor; PONY at $0.36 on a $6.24 stock is 5.8%. VWAP shows above or below VWAP: all six bullish setups were Above, all three bearish setups were Below. REL STR is the underlying's 1-hour price change minus SPY's 1-hour change: MU at +0.85, CLS at +0.71, GEV at +0.64, all outperforming SPY on the hour and triggering the relative strength bonus in their scores. APP at -0.12 was slightly underperforming SPY to the downside.
FLOW 5D appears when the Flow context toggle is on. It shows total premium from unusual options prints above $50,000 over the last five trading sessions, plus the count of those prints shown as a multiplier. MU showed $2383.3M with 401 such prints (×401). CLS showed $1.4M with 3 prints. COHR showed $8.7M with 25 prints. This is context about the options environment around the underlying over the recent past. It is not an input to EdgeScore.
Reading the October 1 session
MU at score 85, TREND badge, 1.81x relative volume, +3.03% on the day, Above VWAP, and relative strength of +0.85 is about as clean a profile as this screener produces. All three trending conditions aligned, volume confirmed participation, and the name was running its own move rather than tracking SPY.
COHR at score 70 with +10.90% on the day is worth separating from the others. A 10% single-session move on the underlying means COHX, the 2x bull ETF, was tracking roughly twice that daily gain. ATR of $21.37 on a $319 stock is about 6.7%, well above the percentage floor. A name moving that much intraday is exactly the type of setup this screener was designed to surface quickly.
The N/A rows (APP and PONY) have confirmed, scored bearish trending setups: APP at 68, PONY at 65. The setups are real. The ETF column is just the final word on what instrument is available to express them with leverage. All three names had above-average relative volume and were trading below VWAP, so the bearish case on the underlying was well-supported. The N/A reflects product availability, not setup quality.
Alignment label
The screener computes an alignment label from the daily, 1H, and 15M trends. ALL BULL means all three timeframes agree on an uptrend. ALL BEAR means all three agree on a downtrend. MIXED with an up or down arrow means two of three agree. CHOPPY means no majority direction.
The recommended ETF uses the 1H trend direction specifically. A MIXED UP reading (daily and 1H bullish, 15M bearish) still produces a bull ETF recommendation because the 1H is the confirming timeframe. Alignment is context about how clean the setup is, not a gate on the recommendation. CHOPPY setups rarely clear the EdgeScore floor on their own.
The underlying vs the fund
COHX, the 2x bull ETF for COHR, has meaningfully lower daily volume than COHR itself and wider bid-ask spreads. Its hourly chart is choppier because the thinner volume produces less reliable price action. The setup lives on the underlying. The fund is the vehicle.
For Trending mode setups this difference is mostly a practical execution matter. For Ignition mode, where the timing window is tighter and the signal is earlier-stage, the gap between signal quality on the underlying and execution on the fund is more relevant. The recommendation column answers "which fund." The columns that answer "how strong is the setup" (score, rel vol, VWAP, RS) all read from the underlying, not the fund.
Key point: Score, rel vol, VWAP, and relative strength all come from the underlying stock, not the ETF. The ETF is the instrument to execute; the underlying is where the setup lives.
Common misreads
-
Reading the score without checking the ETF column first. A score of 68 on APP with a TREND badge is a confirmed bearish setup. "N/A (no bear ETF)" in the next column is the complete answer on available instruments.
-
Evaluating the setup using the ETF's chart. LITX trades less volume than LITE. Technical readings on the fund are noisier because the volume isn't there to smooth price action. The setup information lives on the underlying's chart.
-
Expecting exactly 2x the underlying's daily return. Tracking error, intraday rebalancing mechanics, and spread all introduce deviation from the theoretical multiple. The screener's value is identifying which underlying has the strongest setup at a given moment.
-
Substituting a fund found independently when the ETF column shows N/A. The map covers verified, listed funds with adequate volume. A product found outside the map introduces unknowns about liquidity, actual leverage ratio, and tracking behavior that the screener's scoring was not calibrated around.
Watch out: Tracking error means the fund's actual return deviates from the theoretical 2x on any given session. On a 5% underlying day, a 2x fund might close at +9.1% or +10.3%. The screener identifies the underlying setup; what the fund does on any single day is an approximation.
Pairing with other tools
Live Flow shows the $20k-plus options tape rolled up per ticker: total premium, trade count, directional split, and the largest recent individual print. When COHR is at score 70 on this screener and Live Flow is simultaneously showing heavy bullish call premium on COHR, those are two independent data sources pointing the same direction.
Unusual Activity surfaces individual scored options prints that stand out on volume and premium. A leveraged screener hit on a name that simultaneously has a large call sweep appearing on Unusual Activity is a different kind of evidence than the equity-side setup alone.
Sector Flow shows institutional options flow broken out by sector. The October 1 results were concentrated in semiconductor and optics names. If Sector Flow was showing strong bullish institutional flow into semiconductors at the same time, that sector-level context adds weight to individual setups within it.
GEX covers dealer positioning from options exposure. A strong trending setup during a negative GEX regime faces more potential for intraday reversal than the same setup in a positive one, because dealer hedging flows tend to amplify moves in one environment and dampen them in the other.
How to use this screener: what to look at in order
Try this: Work through each row in this order. Skip any row where the ETF column shows N/A before spending time on the score.
1. ETF column first. Any "N/A (no bear ETF)" row has a confirmed setup with no vehicle to express it through a 2x fund. Set those rows aside before spending time on the scores.
2. SCORE and SETUP together. A high score on a TREND badge in a sector that has been moving across multiple sessions is a different situation from a borderline score on a GAP badge late in the day. SETUP tells you which mode fired and something about the stage of the move: Gap setups are freshest close to the open, Ignition setups are in the building phase before ADX has fully confirmed, Trending setups are already in motion with the full technical confirmation behind them.
3. REL VOL and VWAP. Volume at or near 1.2x on a Trending setup means the screener's internal threshold was barely met. VWAP contradicting the trend direction (a bullish setup trading below VWAP, or vice versa) is worth pausing on.
4. REL STR and FLOW 5D. Relative strength tells you whether the move is company-specific or market-driven. FLOW 5D gives you the recent options activity context: total premium from unusual prints above $50,000 over the last five sessions, and how many such prints occurred. Both are context, not sorting inputs.
One thing the screener doesn't tell you
The ETF map is a snapshot of what was listed and verified at a point in time. New single-stock 2x funds get launched periodically, and delisted ones disappear without notice, and the pace of new listings has been faster on the bull side than on the bear side, which is already visible in how many N/A rows appear on bearish setups versus bullish ones. A name you track that has no mapped fund today might get one added later, and the screener would not reflect that until the map is updated manually. The coverage gaps on the short side are real and are unlikely to close evenly as new products come to market.
Options trading involves substantial risk and is not suitable for all investors. Leveraged ETFs carry amplified risk from daily rebalancing, and losses in choppy or sideways conditions can accumulate in ways that exceed the underlying stock's move in either direction. Nothing in this article is investment advice, and past screener outputs do not predict future results.