Loading...

Options Screeners deep dive · 17 min read
How to Use the LEAPS Scanner
A complete walkthrough of the LEAPS Scanner on TraderMatrix: every preset, column, score formula, and filter explained with real numbers from the October 1, 2026 session. Includes why IV rank works backwards for LEAPS buyers.
Open the tool →Hey guys, Art from TraderMatrix here. If you've spent any time on the CSP Wheel or Covered Calls screeners, you've learned that high IV rank is the good reading. High IV means expensive options, and selling expensive options is the whole game for premium sellers. I'm going to ask you to park that for this guide, because the LEAPS Scanner is the reverse. Low IV rank is what you want here. Buying expensive options is a bad start to a long-duration position, and if you open this screener with the CSP mindset intact you'll filter for the wrong thing. That single reversal is worth more than any other sentence in this guide.
OK, with that out of the way, let's walk the page properly.
The short version:
- Low IV rank is the good reading for LEAPS buyers; high IV means you're paying expensive time premium.
- Stock Replacement mode targets deep in-the-money calls with delta 0.75 to 0.90.
- Extrinsic percentage is the dominant scoring factor at 40% weight; lower is better.
- The leverage ratio is a capital efficiency number, not a return multiplier; actual gains come from delta.
- Run the Cheap Vol preset when you want only names near their annual volatility floor.
What LEAPS actually are
LEAPS stands for Long-Term Equity Anticipation Securities. In practice it just means an option with a long expiration: the platform uses 180 days as the floor. The reason you'd use one instead of a regular short-dated option comes down to theta, which is the daily cost of holding an option.
A 45-day call decays noticeably every single day. The option loses value from time alone whether or not the stock moves, and that decay accelerates in the final weeks. A 450-day call also decays, but the daily dollar cost is spread across a much longer runway. You can hold through an earnings miss, a sector rotation, and two months of sideways chop and still have most of your position intact. That's the structural reason people use LEAPS: you get a leveraged bet on a stock's direction without the same urgency that comes with short-dated options.
The trade-off is capital. LEAPS cost more in absolute dollars, and that extra cost is mostly extrinsic value, meaning time premium. One of the scanner's main jobs is finding setups where the extrinsic portion is as small as possible relative to what you paid.
What splits an option premium into intrinsic and extrinsic
Every option price is a combination of two things.
Intrinsic value is how much the option is already in the money. For a call, it's the stock price minus the strike, floored at zero. PFE is at $28.12 in the October 1 session and the scanner found a $20 strike call. That call has $8.12 in intrinsic value (28.12 minus 20). The contract's mid price is $8.50. The remaining $0.38 is extrinsic, the time and volatility premium that bleeds away regardless of what Pfizer does. As a percentage of the mid, that $0.38 is 4.5%. Most of what you're paying for is already there in the money.
CCL is at $25.07 with a $15 strike. Intrinsic is $10.07. Mid is $11.10, so extrinsic is $1.03, or 9.3% of the premium. Still mostly intrinsic, but a higher fraction of the premium is pure time value compared to PFE.
SPCX is at $148.07 with a $100 strike, 258 DTE. Intrinsic is $48.07. Mid is $55.70, so extrinsic is $7.63, which is 13.7%. Real intrinsic value, but you're paying meaningfully more for the time component than PFE or CCL.
A contract can also have no intrinsic at all if the strike is above the stock price for a call, or below it for a put. That's an out-of-the-money contract, and every dollar of its premium is pure extrinsic. The Leveraged Directional mode specifically looks for those.
Delta: the directional exposure number
Delta tells you how many cents the option moves for every dollar the stock moves. PFE's $20 strike call has delta 0.88. When PFE moves $1.00, the option moves roughly $0.88. At 0.88 delta you're getting most of the stock's participation at a fraction of the capital required to buy 100 shares outright. That's the stock replacement premise.
The scanner has two delta windows. Stock Replacement (the default) targets delta 0.75 to 0.90: deep in the money, high directional sensitivity. Leveraged Directional targets delta 0.35 to 0.50: closer to at-the-money, more leverage per dollar but more extrinsic to overcome if the stock goes sideways.
Why IV rank works backwards here
To sell a cash-secured put well, you want the underlying's IV rank to be high. The stock's own implied volatility is near its annual peak, so options are priced richly relative to their own history. You collect more premium for the same strike.
Buying LEAPS is the exact opposite transaction. You're paying that premium. A high IV rank means the options are expensive. You're buying in when implied vol is elevated, which inflates the extrinsic component of everything on the chain. For Stock Replacement LEAPS where you're trying to minimize extrinsic, entering at high IV is the worst possible timing.
The IV RANK column shows a number from 0 to 100 and a text label. Zone buckets: a rank near zero shows "annual low," below about 25 shows "cheap," the middle range shows "mid," and elevated readings above about 50 show "rich." For a LEAPS buyer, cheap and annual low are what you want. Rich is a reason to wait.
Key point: SPCX on October 1 shows IV rank 0, labeled "annual low." Implied volatility is sitting at the absolute cheapest point of its own 52-week range. That says nothing about whether SPCX will go up. It says that if you were going to buy a long-dated call on SPCX, this is about as cheap as that time premium gets relative to recent history for this specific ticker.
The Cheap Vol (IV Rank) preset sets the max IV rank to 5. That's deliberate. It targets names sitting at or near their annual volatility floor. The default run shows everything regardless of IV rank, so you'll see cheap and rich sitting next to each other in the same table. You have to use the IV RANK column yourself unless you activate that preset.
The page
Live route is /screeners/leaps. The header shows "LEAPS Scanner" with a "180+ DTE" tag and three buttons: Watch tutorial, How to Use, and Add to My Desk. Below it, a short blurb explains the premise: flag the LEAPS where you're buying cheap volatility instead of expensive extrinsic, so your capital isn't decaying for nothing. Click any ticker to see its chart.
On October 1 the scan returned 13 results. The Export and Run scan buttons sit in the top-right of the content area.
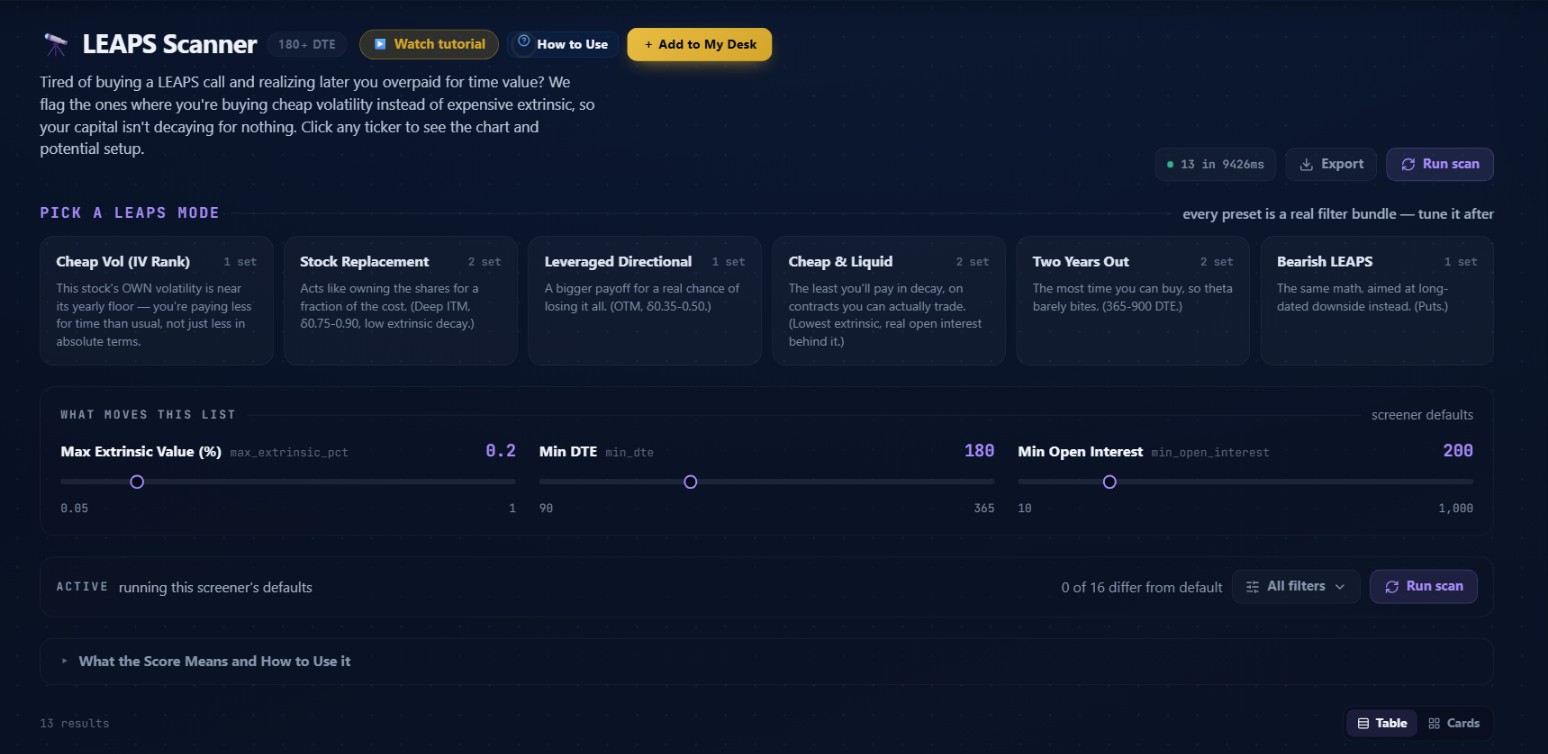 The top section on October 1, 2026. Six preset mode cards, sliders at defaults, ACTIVE chip showing 0 of 16 filters changed. PFE leads the results with score 76.2.
The six preset cards
The section labeled "PICK A LEAPS MODE" has six cards. Each one is a pre-built filter bundle that pushes specific parameters into the screener when you click it. Every preset is a real filter bundle; tune it after.
- Cheap Vol (IV Rank): pushes one filter, max_iv_rank set to 5. You'll often see fewer results than the default run, but every result passes the cheapest-vol-on-this-specific-ticker test.
- Stock Replacement: pushes two filters, max_extrinsic_pct drops from 20% to 12%, and min_dte goes from 180 days to 365 days. True stock replacement wants a full year of runway and very little time bleed per month.
- Leveraged Directional: switches mode from stock_replacement to leveraged. That shifts the delta target from 0.75-0.90 to 0.35-0.50 and changes the score weighting entirely, with capital efficiency driving 70% of the score.
- Cheap & Liquid: pushes two filters, max_extrinsic_pct to 10% (stricter than any other preset) and min_open_interest up to 500. The most conservative entry on the list.
- Two Years Out: pushes two filters, min_dte 365 and max_dte 900. Keeps only contracts expiring one to 2.5 years from now. For a slow-developing thesis, this is the one.
- Bearish LEAPS: switches direction from bullish to bearish, moving from calls to puts. All the same math, aimed at long-dated downside.
The three hero sliders
Below the preset cards, "WHAT MOVES THIS LIST" shows three parameters the screener designers considered most relevant to actively tweak.
Max Extrinsic Value (%) defaults to 0.2 (20%). Below 20% means at least 80% of the premium is intrinsic. The slider runs from 0.05 to 1.0. Lower values produce fewer results but tighter contracts. The Stock Replacement preset drops this to 12%.
Min DTE defaults to 180. True LEAPS territory. The slider runs from 90 to 365 days.
Min Open Interest defaults to 200. This is a hard floor applied in the chain analysis phase, not a scoring bonus. A contract with 199 open interest doesn't appear regardless of any other metric. Cheap and Liquid pushes this to 500.
The ACTIVE chip below the sliders showed "running this screener's defaults" and "0 of 16 differ from default" on October 1. The screener has 16 total parameters. The "All filters" button expands the full panel to show min/max stock price, RSI range, volume floor, contract cost range, IV rank band, and result count.
Below the filters, a collapsible "What the Score Means and How to Use it" section explains the scoring in plain text. Worth reading once when you first open this page.
The three-stage funnel
This runs when you click Run scan. It's not a database lookup; it's an active three-stage pipeline.
Stage one queries a pre-filter for candidates matching the stock-level criteria: exchange (NYSE, NASDAQ, AMEX), stock type (common stock, primary listing, no ETFs or ADRs), price range, minimum average volume, and RSI bounds. It also applies a trend alignment check before doing any options work.
Stage two queries expirations for each candidate and keeps only those with DTE within the active min/max window. A lot of names don't have LEAPS listed at all. This stage eliminates them before the expensive per-contract analysis.
Stage three pulls the full chain for each qualifying expiration, filters to the active delta range and option type, and drops anything with spread above 15% of mid, open interest below 200, or an invalid mid price. The screener then scores every surviving contract and surfaces the single highest-scoring one per ticker across all qualifying expirations and strikes.
Key point: For bullish mode, stage one requires ADX at least 20 and RSI at least 45. The scan won't surface a bullish LEAPS on a stock that's technically in a downtrend. If a name you expect to see doesn't appear, its trend alignment may be failing this check.
The results table
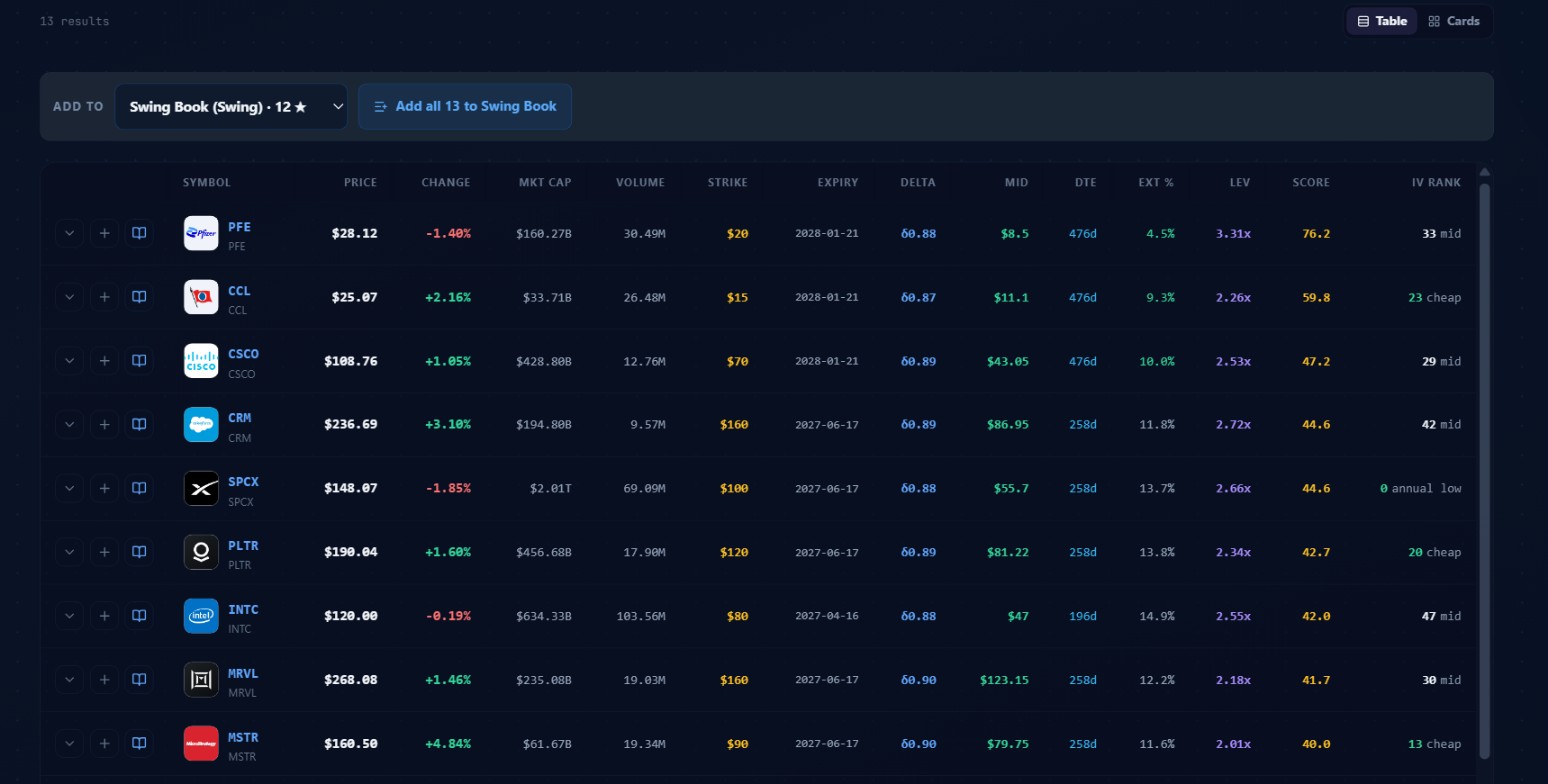 The full results table on October 1, 2026. Thirteen results; visible here are PFE (score 76.2) through MSTR (score 40.0). Each row is the single best-scoring contract found across all qualifying expirations for that ticker.
Walk through each column:
- SYMBOL / PRICE / CHANGE / MKT CAP / VOLUME: the underlying stock's data. The stock has to meet the stage one filters before any option contract is evaluated.
- STRIKE: the strike price of the chosen contract. In Stock Replacement mode, this will always be below the current stock price (in the money), meaning the contract has intrinsic value.
- EXPIRY: the expiration date. On October 1, most results showed either January 2028 (477 DTE) or June 2027 (259 DTE). January expirations typically carry the most open interest and tightest spreads across most underlyings.
- DELTA: how the contract moves with the stock. Every row in the default Stock Replacement run showed delta between 0.87 and 0.90 on October 1.
- MID: the bid-ask midpoint. Every calculation on this page uses this number: extrinsic percentage, leverage ratio, and score all derive from it. If the mid is null because the market is crossed or missing, the contract doesn't appear.
- DTE: days to expiration. PFE, CCL, and CSCO showed 476 DTE (January 2028). CRM, SPCX, PLTR, MRVL, and MSTR showed 258 DTE (June 2027).
- EXT %: extrinsic value as a percentage of mid. For a call: intrinsic = max(0, stock price minus strike). Extrinsic = max(0, mid minus intrinsic). Extrinsic% = extrinsic divided by mid. This is the dominant component in the Stock Replacement score.
- LEV: the leverage ratio, stock price divided by option mid. PFE at $28.12 divided by $8.50 is 3.31x. CCL at $25.07 divided by $11.10 is 2.26x. SPCX at $148.07 divided by $55.70 is 2.66x.
- SCORE: the EdgeScore from 0 to 100. Computed differently per mode.
- IV RANK: shows the number and zone label. PFE: 33 "mid." CCL: 23 "cheap." SPCX: 0 "annual low." PLTR: 20 "cheap."
Watch out: The leverage ratio does not mean a 10% stock move becomes a 33% option gain. The ratio measures capital efficiency: you put up 30 cents for every dollar of stock position at 3.31x. Your actual dollar gain comes from delta. PFE with delta 0.88 on a $2.81 stock move earns roughly $2.47 on the option, about 29% on an $8.50 mid. Good leverage, just not 3.31x leverage.
The ADD TO Swing Book bar below the result count lets you add individual tickers or all results to a watchlist. On October 1 the Swing Book had 12 existing entries.
How the EdgeScore is calculated
For Stock Replacement mode, four components:
| Component | Weight | What it measures |
|---|---|---|
| Extrinsic efficiency | 40% | Maps extrinsic% to score; 0% extrinsic = 100, 30% extrinsic = 0, linear between |
| Capital efficiency | 30% | (delta x stock price) / mid; a reference of 5x scores 100 |
| Theta efficiency | 20% | Daily theta-to-delta ratio; zero credit when the ratio exceeds 0.01 |
| Liquidity | 10% | Spread tightness (60% of this component) and open interest (40%, capped at 1,000 OI) |
For Leveraged Directional mode, the formula changes: capital efficiency takes 70%, theta takes 20%, and liquidity takes 10%. Extrinsic drops out entirely. An OTM contract is 100% extrinsic by definition, so ranking by how little extrinsic you're paying is incoherent when every contract on the screen is 100% extrinsic. The mode focuses entirely on how much exposure you get per dollar and how slow the daily bleed is.
Specific October 1 results
PFE scored 76.2, the highest of the session. $20 strike call, January 2028, 476 DTE, delta 0.88, mid $8.50, 4.5% extrinsic, 3.31x leverage. Nearly all of the $8.50 is intrinsic. That 4.5% extrinsic is what drives the score. IV rank is 33 (mid), so the vol environment is neutral.
CCL scored 59.8. $15 strike on a $25.07 stock, also January 2028, 9.3% extrinsic, 2.26x leverage, IV rank 23 "cheap." Lower score than PFE despite the cheaper IV rank, because the extrinsic percentage is higher (9.3% vs 4.5%). If the volatility entry point matters more to you than extrinsic efficiency, CCL is the more favorable IV environment of the two. If you care about minimizing time decay, PFE is cleaner.
SPCX scored 44.6 with IV rank 0 at the annual low. $100 strike on a $148.07 stock, June 2027 expiry, 258 DTE, 13.7% extrinsic. The score is middling because the extrinsic component is meaningful at 13.7%, which pulls down the 40%-weighted extrinsic factor. The IV rank tells a different story though: this is the cheapest implied vol has been for SPCX all year.
CRM at $236.69 with a $160 strike, 258 DTE, 11.8% extrinsic, score 44.6, IV rank 42 "mid." PLTR at $190.04 with a $120 strike, 258 DTE, IV rank 20 "cheap," score 42.7. MSTR at $160.50 with a $90 strike shows the lowest leverage on the visible portion of the list at 2.01x, score 40.0, IV rank 13 "cheap."
One detail the table doesn't make explicit: if a ticker had five different valid expiry dates in the DTE window, the scanner scored contracts from all five and kept the single highest-scoring one. The row you see is the winner of that internal competition.
Green and red flags
Signals worth acting on:
| Signal | What it means |
|---|---|
| IV rank below 25 ("cheap" or "annual low") | Paying less time premium than usual for this specific ticker |
| Extrinsic below 8% | Almost all of the premium is intrinsic; daily theta is small |
| DTE above 365 | Room to hold through a slow thesis without the option expiring |
| Open interest well above 200 | Tighter spreads; easier to exit |
Signals worth pausing on:
| Signal | What it means |
|---|---|
| IV rank "rich" | Elevated vol premium on top of intrinsic value; a disadvantage for buyers |
| Extrinsic above 15% | A meaningful fraction of what you paid will evaporate through theta |
| Spread close to the 15% cap | Will fill at a worse price than the mid shown |
| Near-term binary event | IV already prices in the event premium; you pay for it even though you didn't want it |
Mistakes that keep coming up
Reading the leverage ratio as a return multiplier. "3.31x leverage" on PFE does not mean a 10% stock move becomes a 33.1% option gain. The ratio measures capital efficiency: you're controlling $28.12 of stock for $8.50 of premium. The actual gain is driven by delta. Delta 0.88 on a $2.81 stock move gives roughly $2.47 of option appreciation, about 29% on an $8.50 entry.
Confusing stock price filter with contract cost. The screener has separate filters for the underlying stock price (default $20 to $500) and the contract cost, which is what you actually pay your broker for one LEAP (mid times 100). Setting max stock price to $20 because you want affordable options gets you $20 stocks. To cap what a single contract costs in dollars, use the Max Contract Cost filter in the All Filters panel. It defaults to off.
Entering during elevated IV without checking. The screener defaults show all results regardless of IV rank. On October 1 you had CSCO at IV rank 29 sitting next to INTC at 47. A 47 IV rank isn't disqualifying on its own, but it means implied volatility is above the midpoint of Intel's annual range. The default run won't filter for you.
Selling early because the stock moved a few percent. LEAPS are for a months-long thesis. A 3% move in one week on an 18-month position is noise. The extrinsic value remaining on a 300-day contract is not a loss; it's what you still own. Selling early and capturing only part of the move you originally identified is a common way to reduce the theoretical advantage of LEAPS to roughly nothing.
Watch out: One of the most expensive ways to use LEAPS is to buy them at high IV rank and then sell early on a small move. You pay elevated time premium going in, then forfeit the remaining value coming out. Cheap IV rank on entry and patience on the exit are what make the structure work.
Pairing this with other tools
The screener finds the contract. Whether now is the right time to enter takes a bit more.
Ticker Lab is the most useful follow-up. Once you have a candidate, open Ticker Lab and check the IV rank chart over the past few months. A rank of 5 that arrived last week after a spike is a different entry than a rank that's been low for a month. You want to see the vol has been cheap for a while, not that it just compressed.
Unusual Activity is where you'd look for options flow context on the same underlying. The scanner tells you the contract terms. Unusual Activity tells you whether there's been repeat directional activity on that ticker recently. Two independent sources pointing the same way carry more weight than either one alone.
Sector Flow gives the broader institutional view on the sector your candidate sits in. A LEAPS call on PFE is a healthcare bet that takes 477 days to play out. If Sector Flow shows consistent bearish positioning in healthcare over the past week, that's worth knowing before you commit capital for over a year.
Live Flow rolls up the $20k-plus options tape per ticker into summary cards: total premium, trade count, a bull/bear split, and the biggest recent print. When a LEAPS candidate is also showing heavy bullish premium in Live Flow on the same day, that's real-time corroboration.
The CSP Wheel Screener covers the same directional thesis through a different structure. If you're bullish on PLTR for 18 months, a LEAPS call is one path. A cash-secured put at a strike you'd be comfortable owning is another: you collect premium while waiting for the stock to reach your price. Neither is objectively better; they suit different accounts and different risk tolerances.
A practical routine
Try this: Run the scan at default settings first. Glance at the IV RANK column and sort mentally by the cheap and annual low labels. Those are the setups where the volatility entry is clean. For a stricter filter, click Cheap Vol (IV Rank) before running. On a day when that preset produces nothing, that's also useful information: nothing in the LEAPS universe is near its annual vol floor right now.
For anything that looks interesting, open Ticker Lab on the same ticker. Look at the IV rank chart for the past 90 days. A sustained low reading means the vol has been cheap for a while. A reading that just bottomed after a spike is a different kind of entry, and how comfortable you are with that depends on your view.
The one thing the screener genuinely can't tell you is whether the thesis is right. PFE at 4.5% extrinsic and a neutral IV rank on October 1 is the cleanest technical entry on that list. That doesn't mean Pfizer will be meaningfully higher in 477 days. The screener optimizes the contract. The directional view is still yours.
Options trading involves real risk and is not appropriate for every investor. A LEAPS contract can lose its entire value if the thesis is wrong or if the stock doesn't move enough within the expiration window. Nothing on this page is investment advice, and the data and analysis here are for informational purposes only. Position sizing, trade management, and the decision to enter any trade are solely your responsibility.