Loading...

Smart Tools deep dive · 19 min read
How to Use the IPO Scanner
A full walkthrough of all four tabs: the Upcoming IPOs pipeline, Recent IPOs with the Setup Attention formula, Pre-IPO Radar with 14 weighted evidence signals, and the Transition Log. Covers the complete IPO lifecycle from confidential filing to lockup expiry.
Open the tool →Hey guys, Art from TraderMatrix here. Today we're covering the IPO Scanner, and I want to do it thoroughly: start with what an IPO actually is and why the timing of information matters so much in this space, then walk every tab, every column, and the formulas behind the scores. There's a lot here, but it's genuinely one of the more interesting pages on the platform because it covers something most tools ignore completely: the window before a stock even exists.
The short version:
- Four tabs cover the full lifecycle: private-stage radar, public filing pipeline, recent trading history, and the event log.
- Confidential filings are the strongest radar signal. The market cannot see them, so a high-confidence hit here is meaningful.
- SPACs are blank-check shells priced near $10 with no real price discovery. Separate them from operating companies before reading any score.
- The 180-day lockup artificially shrinks the float. The 6-week window approaching expiry is worth watching in Unusual Activity.
- A HIGH Setup Attention score on an operating company that holds its gains for 30-plus days is more interesting than a fresh pop that fades.
What an IPO is and why timing is everything
Most traders encounter a new listing on the morning it starts trading, when it's already all over the financial news and chat rooms are buzzing. That's the worst time to be figuring out the setup. The people who positioned well already did their work weeks earlier. The IPO Scanner is built around that earlier window.
Here's how the process works.
A private company decides it wants to raise capital from public markets or give early investors a way to exit. It hires investment banks to manage the offering. These banks are the underwriters, and their job is to set the offering price, market the deal to institutional investors, and stabilize the price after trading begins.
The first official step toward going public is filing a registration statement with the SEC. For a US domestic company, that's an S-1. For a foreign company listing on a US exchange, it's an F-1. Both documents disclose the same core information: audited financials, risk factors, business model, management team, how the company plans to use the proceeds, and the terms of the offering.
Here's the nuance that makes the Radar tab valuable. Before filing publicly, many companies submit a confidential draft registration statement to the SEC. This filing doesn't appear on SEC.gov. The market can't see it. The company is testing the regulatory process, getting initial feedback, and keeping competitors and market participants in the dark. A confidential filing is the strongest early signal that a company is seriously working toward a real listing, which is why the scoring system weights it at 35 points, the highest positive weight in the whole system.
Key point: A confidential filing doesn't appear on SEC.gov. The market can't see it. That's why it scores highest in the radar at 35 points. By the time the public S-1 appears, the private-stage window is already over.
Once the public S-1 is out, the company enters roadshow. The management team and bankers travel to institutional investor meetings, presenting the business and gauging demand. This usually runs two to four weeks. Toward the end of roadshow, the company files an S-1/A (or F-1/A for foreign filers) with the proposed price range. That's when you'll start seeing the price range and share count fill in on the Upcoming tab.
The final document before trading begins is the 424B4, the final prospectus. It has the IPO price, number of shares sold, effective date, and lockup terms. When a 424B4 hits the Transition Log, the deal priced the night before and the stock opens for trading that morning or the next.
That first trading day is usually the most volatile session a stock ever has. The IPO price is what institutional allocatees paid through the syndicate. The opening trade on the exchange can be dramatically higher if demand was strong, or it can open below the offer price if the deal was priced too aggressively or the market turned. That first-day behavior is what the Recent IPOs tab captures, along with how the price holds in the weeks after.
Then there's the lockup. Most IPOs include an agreement that prevents insiders (founders, executives, employees, early investors) from selling shares for 180 days from the first trading day. Contractual restriction, not legal. For those 180 days, a large chunk of the total shares outstanding can't be sold. The float is artificially small. When the lockup expires, insiders can sell. Float expands. Supply increases. Options chains that were thin tend to see open interest build because the hedging market normalizes. The 6-week window leading into a lockup expiry is one of the cleaner pre-event setups in the market, and the Transition Log captures exactly when lockups expire.
Key point: The lockup window is worth tracking. When insiders can finally sell, float expands and the options chain tends to normalize. The Transition Log captures lockup expiry dates. The 6-week run-up is when Unusual Activity on the name becomes worth watching.
SPACs vs operating companies
Before you dig into the data, you need to know how to tell these apart. They trade completely differently.
Some of what appears on IPO lists are not operating companies at all. They're blank-check shells, usually called SPACs (Special Purpose Acquisition Companies). These are created specifically to raise money through an IPO and then find a private company to merge with. The shell has no revenue, no operations, no employees. The IPO just raises a pot of cash held in a trust account, and then management goes out and negotiates a deal with some target private company.
The mechanics make them easy to spot:
- Price near $10.00 (represents the trust value)
- Name includes "Acquisition Corp," "Holdings Corp," or similar language
- Symbol sometimes ends in "U" for the unit structure
Watch out: Most of what lists in a given month are SPACs, not operating companies. A HIGH score or large first-day gain on a SPAC reflects the scoring formula's mechanics, not real business performance. Check the company name and IPO price before treating any badge as meaningful.
On Oct 1, 2026, the Recent IPOs tab had BRRKU (Bluerock Acquisition Corp. II), LOVIU (Live Oak Acquisition Corp. VI), LEDRU (Leader's Advantage Acquisition Corp.), and TCGX (TCGX Acquisition Corp.), all acquisition vehicles priced at $10. BRRKU, LOVIU, and LEDRU showed minimal movement from their offer prices. TCGX was the exception at $12.25, up 22.5% from its $10 offer, which is worth checking before grouping all acquisition vehicles as flat holds.
Operating companies are everything else: actual businesses with real price discovery on listing day. VOGX, IMC, SKHY, and ADRX on that same Oct 1 list are operating companies. They can and do move significantly from their IPO prices.
This distinction clears up a lot of confusion when you see a table full of $10 names. Most of what lists in a given month are acquisition vehicles. Different instrument, different dynamics.
Upcoming IPOs
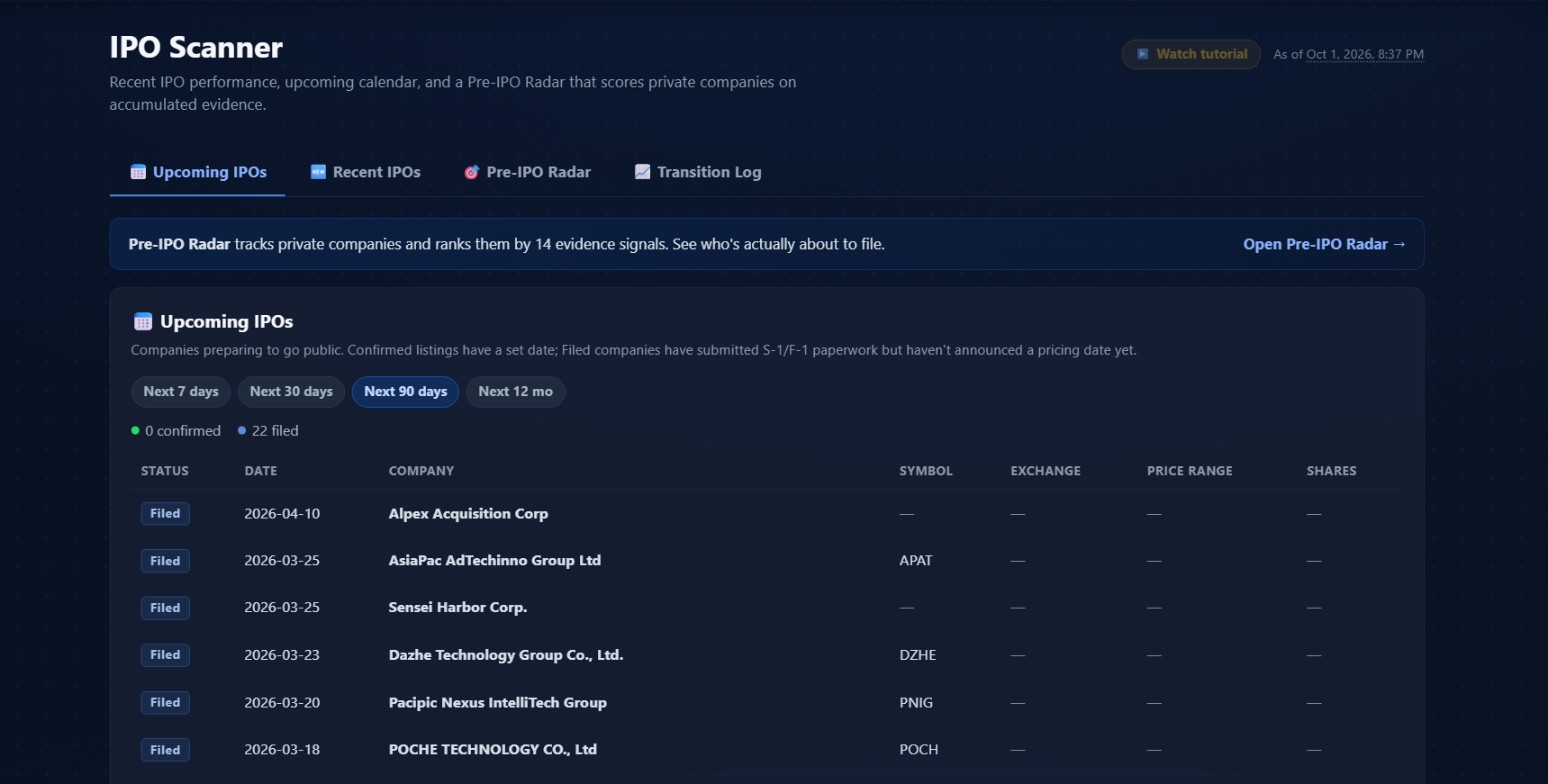 The Upcoming IPOs tab on Oct 1, 2026, filtered to the next 90 days. The Pre-IPO Radar banner at top links to the radar tab. Zero confirmed listings, 22 filed companies visible.
The Upcoming tab shows companies in the pipeline toward a US listing, in one of two states.
Filed means the company submitted S-1 or F-1 paperwork but hasn't announced a pricing date yet. Most of what you'll see here is in Filed status.
Confirmed means the company has an expected pricing date. Final stretch of roadshow, or already pricing.
Four time window chips: Next 7 days, Next 30 days, Next 90 days, Next 12 mo. On Oct 1, 2026, the Next 90 days view showed 0 confirmed and 22 filed.
Table columns: STATUS (Filed or Confirmed badge), DATE (expected pricing date for confirmed names, SEC filing date for filed ones), COMPANY, SYMBOL, EXCHANGE, PRICE RANGE, and SHARES. For companies still in early filing, most of those last four columns show dashes.
Confirmed comes first, sorted by expected date ascending. Filed comes after, sorted by filing date descending, so the most recent filings are at the top of that group.
The dashes aren't missing data. A company in the Filed state genuinely hasn't disclosed those fields yet. The symbol might not even be decided. The price range only appears once they file an S-1/A with a range, usually during roadshow. Until then, the table shows what's actually known.
The banner at the top of the tab reads: "Pre-IPO Radar tracks private companies and ranks them by 14 evidence signals. See who's actually about to file." Companies in the Upcoming tab have already filed publicly. The Radar is for catching them before they file.
Recent IPOs
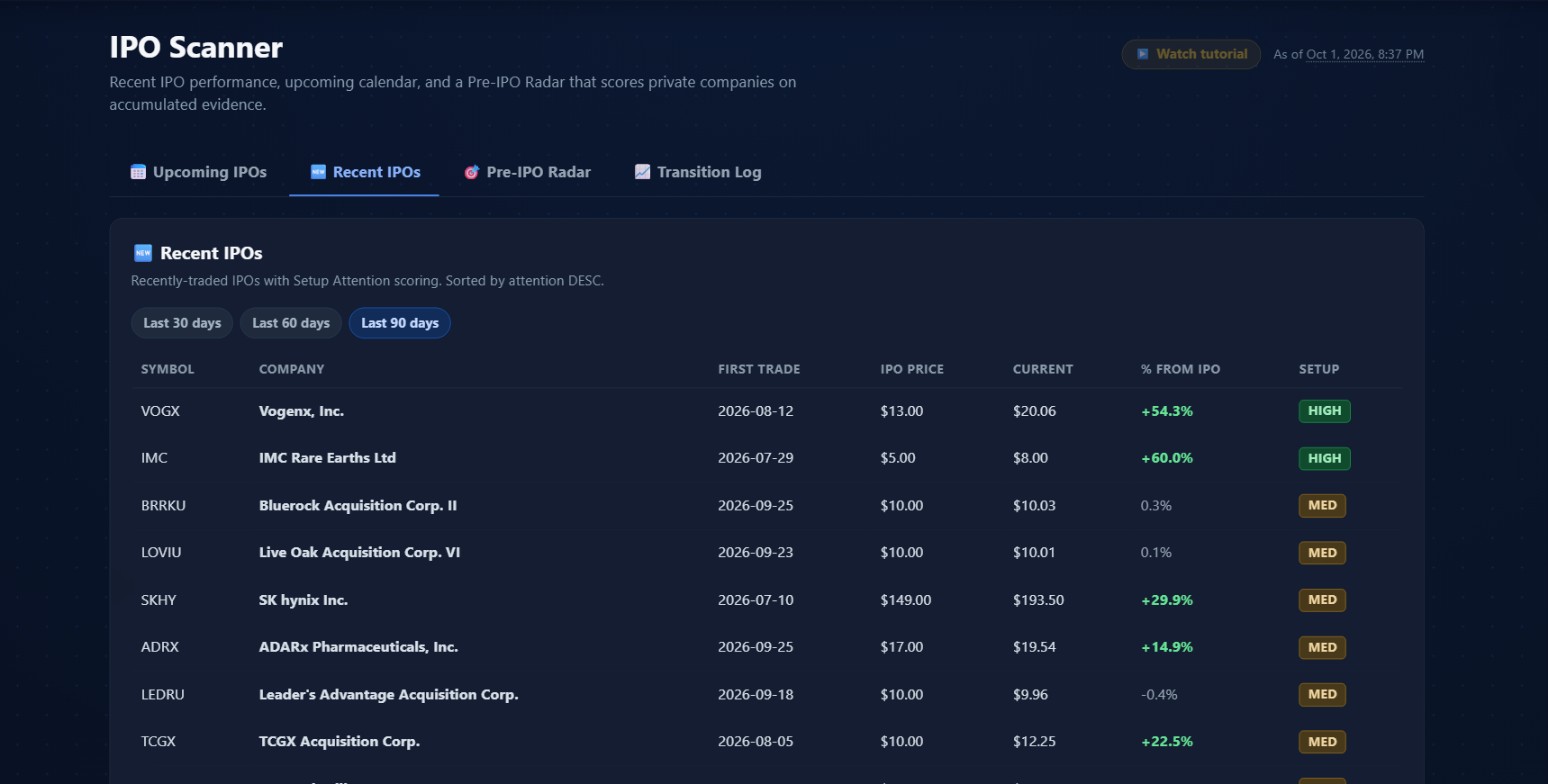 Recent IPOs tab, Last 90 days, sorted by Setup Attention DESC on Oct 1, 2026. VOGX at +54.3% and IMC at +60.0% from their IPO prices are the two HIGH names. Most of the remaining table is acquisition vehicles clustered near $10.
The Recent IPOs tab shows companies that started trading within the last 30, 60, or 90 days, sorted by Setup Attention score descending. Columns: SYMBOL, COMPANY, FIRST TRADE, IPO PRICE, CURRENT, % FROM IPO, SETUP.
The Setup Attention score
Setup Attention is a four-component score, 0 to 100, computed for each recent IPO.
The first component (0 to 40 points) measures the percentage move from offer price to current, clipped to the range -100% to +200% and then scaled. A stock exactly at its IPO price earns 20 points. At +100% above IPO it earns 40. At -100%, nothing.
The second component (0 to 25 points) captures the move from the first-day closing price to current, clipped to plus/minus 50%. This is recent momentum, not just the cumulative IPO gain. Neutral at 12.5 if first-close data is missing.
The third component (0 to 25 points) is a volume ratio: first-day volume divided by the 30-day average daily volume post-listing. A 3x ratio or above gives the full 25 points; below that scales down linearly to 0. Neutral at 5 if missing.
The fourth component (0 to 10 points) is a recency bonus that decays from 10 on day 0 to 0 on day 60. After day 60, zero.
Add all four, round, clamp to 0-100. Tiers: HIGH is 70 or above, MED is 40 to 69, LOW is below 40. The score color on each row reflects the tier: green at HIGH, amber at MED, blue at LOW.
Reading the Oct 1, 2026 table
VOGX (Vogenx, Inc.) had its first trade on 2026-08-12 at $13.00. By Oct 1 it was at $20.06, a +54.3% gain. HIGH. IMC (IMC Rare Earths Ltd) listed 2026-07-29 at $5.00 and hit $8.00, a +60.0% gain. Also HIGH. Both are operating companies.
Below those two, the table is almost entirely acquisition vehicles. BRRKU at $10.03, LOVIU at $10.01, LEDRU at $9.96. They show MED rather than LOW because the recency bonus and first-day volume ratio contribute points even when the price barely moved.
SK hynix (SKHY) is an interesting case. It's a major Korean semiconductor manufacturer that listed US shares on 2026-07-10 at $149.00, trading at $193.50 on Oct 1, +29.9%. MED, because at almost 3 months post-listing the recency bonus has fully decayed.
ADARx Pharmaceuticals (ADRX) had its first trade on 2026-09-25 at $17.00, trading at $19.54, +14.9%. MED. Fresh listing with modest gain.
Pre-IPO Radar
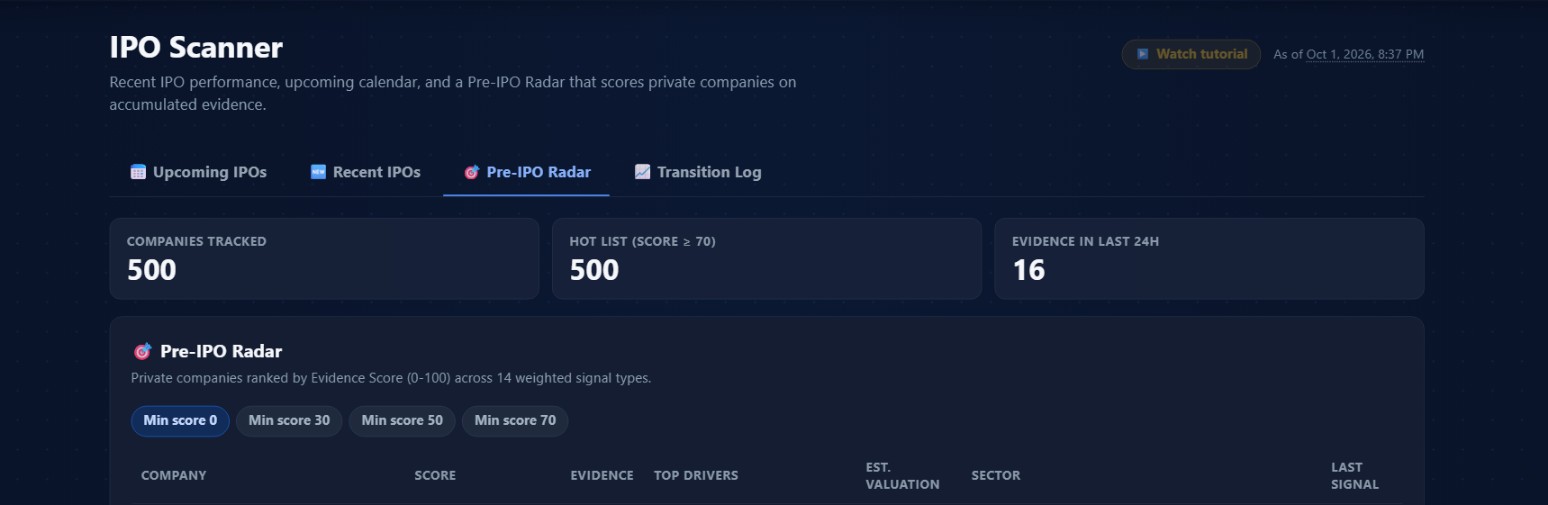 Pre-IPO Radar on Oct 1, 2026. Stat tiles show 500 companies tracked, 500 on the hot list (score 70 or above), 16 with fresh evidence in the last 24 hours. Company rows are cropped; only the stat tiles and column headers are shown.
This is the tab that separates this scanner from a standard calendar feed. The Radar tracks private companies that haven't filed publicly yet, scores them on accumulated evidence, and ranks them by score.
Three stat tiles at the top: Companies Tracked (total in the radar), Hot List (companies with score 70 or above), Evidence in Last 24H (companies that received a new signal in the last 24 hours). On Oct 1: 500 tracked, 500 on the hot list, 16 with fresh evidence.
Table columns: COMPANY, SCORE (bar plus number), EVIDENCE (count of signal rows), TOP DRIVERS (chips for the three signal types contributing the most weight), EST. VALUATION, SECTOR, LAST SIGNAL.
Filter chips at the top: Min score 0, 30, 50, or 70. At 70 you see only the hot list.
The 14 signal types and their weights
| Signal | Weight |
|---|---|
| confidential_filing | 35 |
| public_filing | 30 |
| spin_off | 20 |
| named_underwriters | 20 |
| underwriter_rumor | 20 |
| confirmed_ipo_intent | 18 |
| target_timing | 18 |
| exec_hire | 15 |
| valuation_reported | 12 |
| fundraise | 12 |
| auditor_readiness | 10 |
| secondary_liquidity | 10 |
| generic_rumor | 8 |
| negative_signal | -20 |
The confidential filing weight (35) outweighs a public filing (30) because a draft S-1 filed confidentially is a stronger forward signal. By the time the public S-1 appears, the confidential phase is over and the market already knows. The confidential filing is where the radar catches something the rest of the world can't see yet.
Named underwriters and underwriter rumors are both at 20. Once a major bank is actually involved in the process, whether that's been publicly confirmed or is circulating as a rumor, the fact of involvement is the signal. The exact status matters less.
Spin-offs get 20. A planned corporate separation has passed a board vote and usually requires regulatory filings, which gives it structural momentum that press coverage alone doesn't have.
Negative signals subtract 20 each. A withdrawn IPO, a failed fundraise, or substantiated negative news can feed a negative_signal row and pull the score back down. The radar isn't a one-way ratchet.
How the Evidence Score is computed
Each company has a set of evidence rows. Each row has a signal_type and a confidence value between 0 and 1. The scoring takes all rows, sorts by weight times confidence descending, keeps at most 20, multiplies weight by confidence for each kept row, sums the products, then clamps to 0-100 and rounds.
Worked example: one confidential_filing row at confidence 1.0 contributes 35 points. Add a named_underwriters row at confidence 0.8, that's 16 more. Add a target_timing row at confidence 0.7, that's 12.6 more. Three strong signals and you're near 64. Getting to 80-plus requires multiple high-weight signals at solid confidence. Getting to 100 means the sum of the best 20 rows has hit the cap.
The top drivers column shows the three signal types that contributed the most weight times confidence for that company. Confidential_filing as a top driver is the single most meaningful signal in the system. Generic_rumor as the only top driver, with low evidence count, is the weakest read.
What the score is and isn't
The Evidence Score measures how much evidence has accumulated suggesting a company is moving toward a public listing. It says nothing about when the listing will happen, at what price, or how the stock performs when it does. Score 100 means the evidence is saturated. Some companies stay at high scores for years without listing. Others surprise with a sudden S-1 even with a relatively low radar score.
The negative_signal mechanic makes the score more honest: a company that withdraws its IPO filing takes a -20 hit, and that can drag a score in the 60s down meaningfully.
One thing the score doesn't capture is velocity: a company that went from 0 to 80 in two weeks is a different situation than one that's been sitting at 80 for three years. Both show "80" in the table. You have to look at the evidence drawer and the LAST SIGNAL date to understand which you're looking at.
Watch out: The aggregate score doesn't show whether evidence is diverse or stacked. A score of 72 built from five different signal types at high confidence is different from the same number built from stacked generic_rumor rows. You have to open the drawer to see the difference.
The evidence drawer
Click any radar row and a drawer opens showing every individual evidence row for that company, newest first. Signal type, source, published date, confidence value, and a link to the source if one exists.
A score of 72 with 15 evidence rows could be one high-weight signal and 14 low-weight generic rumors, or it could be five different types of medium-weight evidence all at high confidence. The aggregate score doesn't show you that difference. The drawer does. A high score built on diverse signal types with multiple distinct sources is a different thing than the same number built from stacked generic_rumor rows.
Try this: For any radar company above 65, open the evidence drawer before deciding it's worth tracking. Check two things: whether the top drivers include confidential_filing, public_filing, or named_underwriters, and whether the LAST SIGNAL date is recent. A high score with stale evidence tells a different story than a high score with fresh signals.
Transition Log
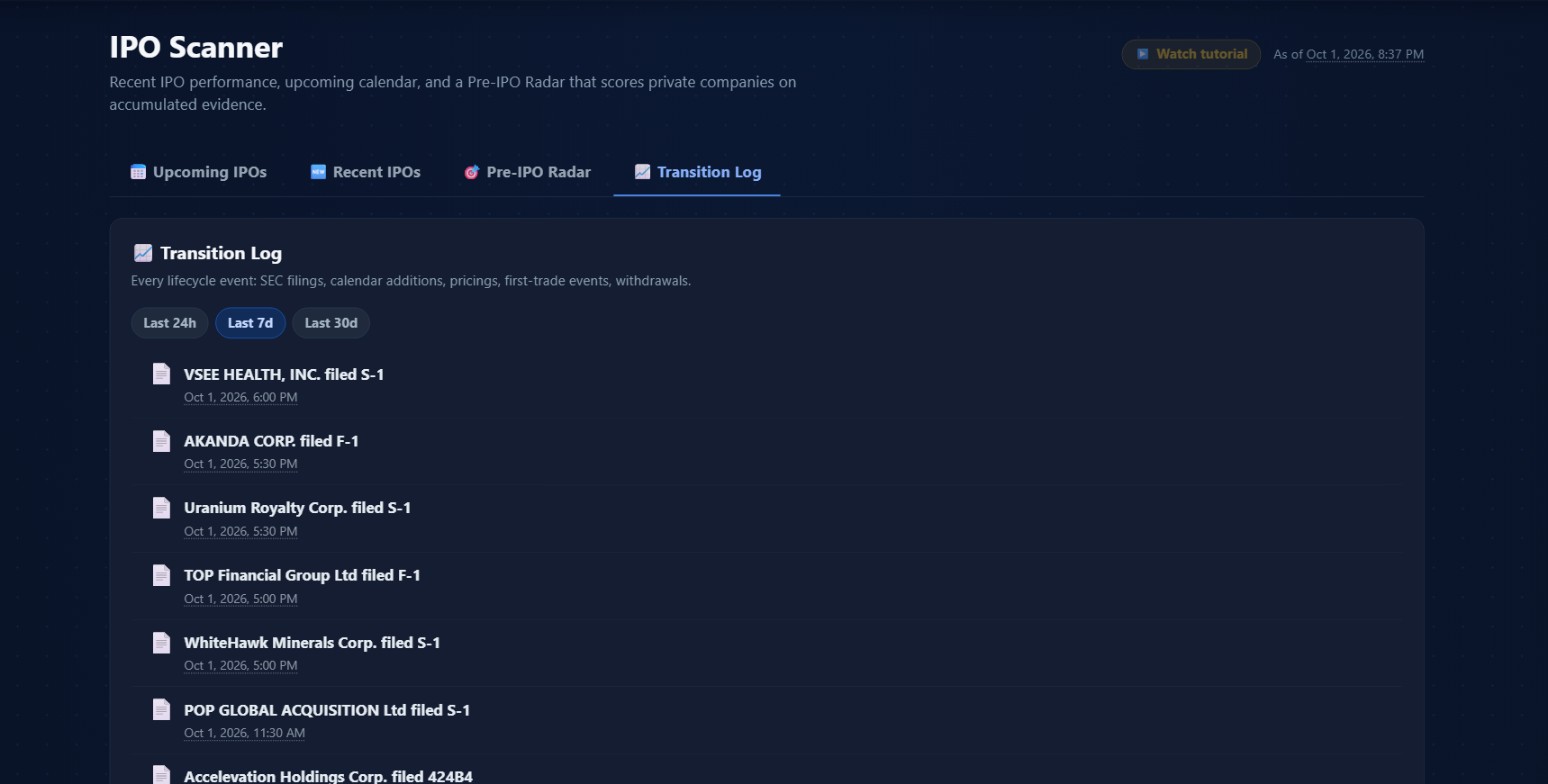 Transition Log, Last 7d on Oct 1, 2026. Seven visible entries for that day: four S-1 filings, two F-1 filings, and a 424B4 prospectus for Accelevation Holdings Corp.
The Transition Log is a chronological event feed for the whole IPO pipeline. Window chips: Last 24h, Last 7d, Last 30d.
Five event types appear in the log:
| Event | What it means |
|---|---|
| sec_filing | IPO-related paperwork filed with the SEC. The most common event. Each entry shows the form type. |
| added_to_calendar | A company with a confirmed pricing date was added to the calendar. |
| priced | The company priced its offering. IPO price shown if available. |
| first_trade | The stock began trading. |
| withdrawn | The company pulled its IPO. This event also feeds a negative_signal back into the radar for that company's score. |
What each filing form means
| Form | What it means |
|---|---|
| S-1 | Initial registration statement for a US domestic company. First public step toward listing. Discloses financials, risk factors, use of proceeds, management. Can still be many months from the actual IPO. |
| F-1 | Equivalent for foreign private issuers. Same disclosure requirements. Used when the company is incorporated or primarily operating outside the US. |
| S-1/A or F-1/A | Amendment to an existing filing. Filed multiple times as the company updates financials, responds to SEC comments, and eventually adds the price range. When an S-1/A includes a price range, the roadshow has started. |
| 424B4 | The final prospectus, filed at pricing. Contains the actual IPO price, final share count, effective date, and lockup terms. When this hits the log, the deal priced last night. |
The form progression tells the story for any name you're tracking. S-1 means they're in the system. S-1/A with a price range means roadshow is happening. 424B4 means it's done.
Key point: A 424B4 in the Transition Log means the deal priced the night before. Check the first_trade event the next day, then watch Recent IPOs over the following 30 days to see whether the name develops into a HIGH attention listing.
The Oct 1 Last 7d view showed seven visible entries for that day: VSEE HEALTH, INC. (S-1), AKANDA CORP. (F-1), Uranium Royalty Corp. (S-1), TOP Financial Group Ltd (F-1), WhiteHawk Minerals Corp. (S-1), POP GLOBAL ACQUISITION Ltd (S-1), and Accelevation Holdings Corp. (424B4). Most filings drop after market close, which is why the log skews toward after-hours entries.
Green flags and red flags
Worth paying attention to:
- A radar company where the top drivers include confidential_filing or public_filing. Both require real regulatory engagement, not just press coverage.
- A company that moves from the Radar into the Upcoming tab within a few weeks of accumulating strong signals. The public filing followed quickly after private-stage evidence built.
- A 424B4 in the Transition Log on a name that had multiple S-1/A amendments with a price range. Orderly form progression.
- A HIGH setup score in Recent IPOs on an operating company that held its gains for 30-plus days. Pops that fade inside a week are mostly noise.
Worth being skeptical of:
- A radar company where the only top driver is generic_rumor with an evidence count below 5. Financial press chatter with no structural signals behind it.
- A company in the Upcoming tab with a filed date more than 6 months ago and no S-1/A amendments in the Transition Log. Often stalled, informally withdrawn, or pivoted to private financing.
- A HIGH setup score on an acquisition vehicle near $10. The recency bonus and first-day volume ratio can push shells into MED or HIGH. That's not the same thing as a HIGH operating company with a real gain. Look at what the company actually is before deciding what the badge means.
How it pairs with other tools
Once a recent IPO generates enough options volume, Live Flow is where you'll see it first. Live Flow shows per-ticker roll-ups of the options tape: total premium, trade count, bull/bear split, and the biggest print. A newly-listed company with a small float and a fresh options chain generates unusual-looking numbers because the base is so small. Calibrate for that.
In the weeks before a lockup expiry, Unusual Activity is worth watching on IPO names. Insiders who want to hedge before their lockup lifts often buy puts or sell calls before they can actually exit shares. That pre-lockup positioning can show up in unusual activity before the event itself.
After the lockup passes and the stock has a 6-month track record, the LEAPS Scanner starts to make sense. The options chain has had time to develop real open interest and the pricing is more reliable.
For sector context, if you're watching a cluster of S-1 filings in one industry through the Transition Log, Sector Flow can tell you whether institutional options flow is rotating toward or away from that sector at the same time.
A simple weekly routine
Once a week: Pre-IPO Radar at Min score 50. Find companies above 65 where the last signal was within the past 7 days. Look at the top drivers. Anything with confidential_filing, public_filing, or named_underwriters in the top three is worth tracking.
Then check the Transition Log on Last 7d. Have any of those names filed an S-1 or F-1 this week? If yes, they've crossed from private-stage watching to active pipeline watching. They'll show up in the Upcoming tab.
When a name you're tracking files an S-1/A with a price range in it, roadshow is underway. A 424B4 is probably 2-4 weeks out.
Try this: Build the weekly habit in that order: Radar at Min score 50 first, then Transition Log Last 7d, then Upcoming. Each tab feeds the next. Radar tells you who is building evidence. Transition Log tells you who just made a filing move. Upcoming shows you the confirmed pipeline.
When the 424B4 hits, check the first_trade event the next day. Then watch Recent IPOs for the first 30 days. A HIGH attention score that holds for a month means the stock is performing, and that's when it becomes relevant to the options flow tools.
What this scanner is not
The Upcoming tab shows what has been filed, not what will definitely list. Companies file S-1s and then withdraw or delay for months. Pipeline view, not a guarantee.
The Pre-IPO Radar score measures evidence accumulation, not IPO timing or post-listing performance. Some companies with scores near 100 have been there for years without listing.
The Setup Attention score captures price performance, volume, and recency in a single number. A HIGH badge means the stock ranks well on that combination among recent listings. It says nothing about direction from here.
IPO stocks are structurally different from established public companies. The float is small. A large portion of shares is locked up for 180 days. The options chain, if it exists at all in the early weeks, tends to have wide spreads and thin open interest. These are properties of the asset class, not problems with the scanner.
Trading involves substantial risk of loss and is not suitable for all investors. Nothing here is investment advice or a recommendation to buy or sell any security. IPO stocks carry elevated risk: limited price history, locked-up insider shares, and thin options chains in the early trading period.