Loading...

Markets & Smart Money deep dive · 14 min read
How to Read the Futures GEX Calculator
A complete walkthrough of the Futures GEX Calculator at /gex -- what gamma exposure is, how to read every level and card, and how to build a pre-session plan around the flip, walls, and regime. Real screenshots from October 19, 2026.
Open the tool →Hey guys, Art from TraderMatrix here. The Futures GEX Calculator lives at /gex in the nav. I look at it before every session, usually for about thirty seconds, and those thirty seconds shape how I structure whatever trades I am considering. The page tells me whether dealer hedging is going to fight price or feed it today. Everything else builds on that one read.
This guide walks through the whole page: what gamma exposure is in plain terms, what each level means, how every panel and toggle works, and how to put it together before the open.
The short version:
- Positive GEX means dealer hedging dampens price moves. Negative GEX means it amplifies them. That single distinction changes your trade structure for the day.
- The gamma flip is the price level where the regime switches. Opening above or below it tells you whether the session has a range-compression or trend-continuation character.
- The call wall is the strike with the most concentrated dealer resistance on a rally. The put wall is where dealer buying concentrates on a dip.
- The levels strip at the top shows changes since a specific date. Watch which levels are holding steady versus which ones are drifting.
- Chain Activity carries an explicit disclaimer on the page because volume direction is ambiguous. Read it before drawing any directional conclusion from it.
- The expiry selector isolates which expiration is actually driving the GEX structure on a given day.
What gamma exposure is
Gamma exposure is a number, in dollars, that answers this question: how much stock does a market maker have to buy or sell for every one percent move in price, just to stay delta-neutral?
When someone buys a call option, a market maker typically sells it to them. That market maker is now short a call. They do not want to hold a directional bet, so they buy some of the underlying stock to delta-hedge. Now the stock ticks up. The delta of that short call goes up. The market maker is suddenly under-hedged, so they buy more stock. Price goes up further, they buy more. This feedback loop runs in reverse when they are short the option.
GEX aggregates this hedging activity across all open options contracts at each strike. The result is a dollar figure that shows where dealer hedging is densest and which direction that hedging will flow when price moves.
Two regimes come out of this:
Positive GEX: Dealers are net long gamma. When price rallies, dealers sell to hedge. When price drops, dealers buy. Their hedging creates friction against the move and tends to pull price back toward equilibrium. Sessions in positive GEX tend to have compressed ranges and mean-reversion tendencies. Fading the extremes fits.
Negative GEX: Dealers are net short gamma. When price rallies, dealers buy more to re-hedge. When price drops, dealers sell more. Their hedging accelerates the move rather than dampening it. Sessions in negative GEX tend to have expanded ranges and trend-continuation tendencies. Following the break fits; fading it is expensive.
The gamma flip is the exact price level where net dealer GEX crosses zero. Above the flip, you are in the positive regime. Below it, you are in the negative regime. Where spot sits relative to the flip is the first thing I check every morning.
What the page is and isn't
The GEX Calculator is a structural context tool. It tells you how dealer hedging is likely to behave when price moves. It does not tell you which direction price will move, when it will move, or how large any move will be. It tells you what the environment looks like.
A strong negative GEX reading does not mean the market is going down. It means that if the market goes down, the move is more likely to extend. A strong positive GEX reading does not mean the market will stay flat. It means dealer mechanics are working against a large move in either direction.
Hard catalysts overpower GEX entirely. On an FOMC day, a CPI print, or around a major earnings event, the options market reprices faster than the gamma structure can adapt. Treat GEX as structural context on normal days and as advisory only around scheduled catalysts.
Reading the page, top to bottom
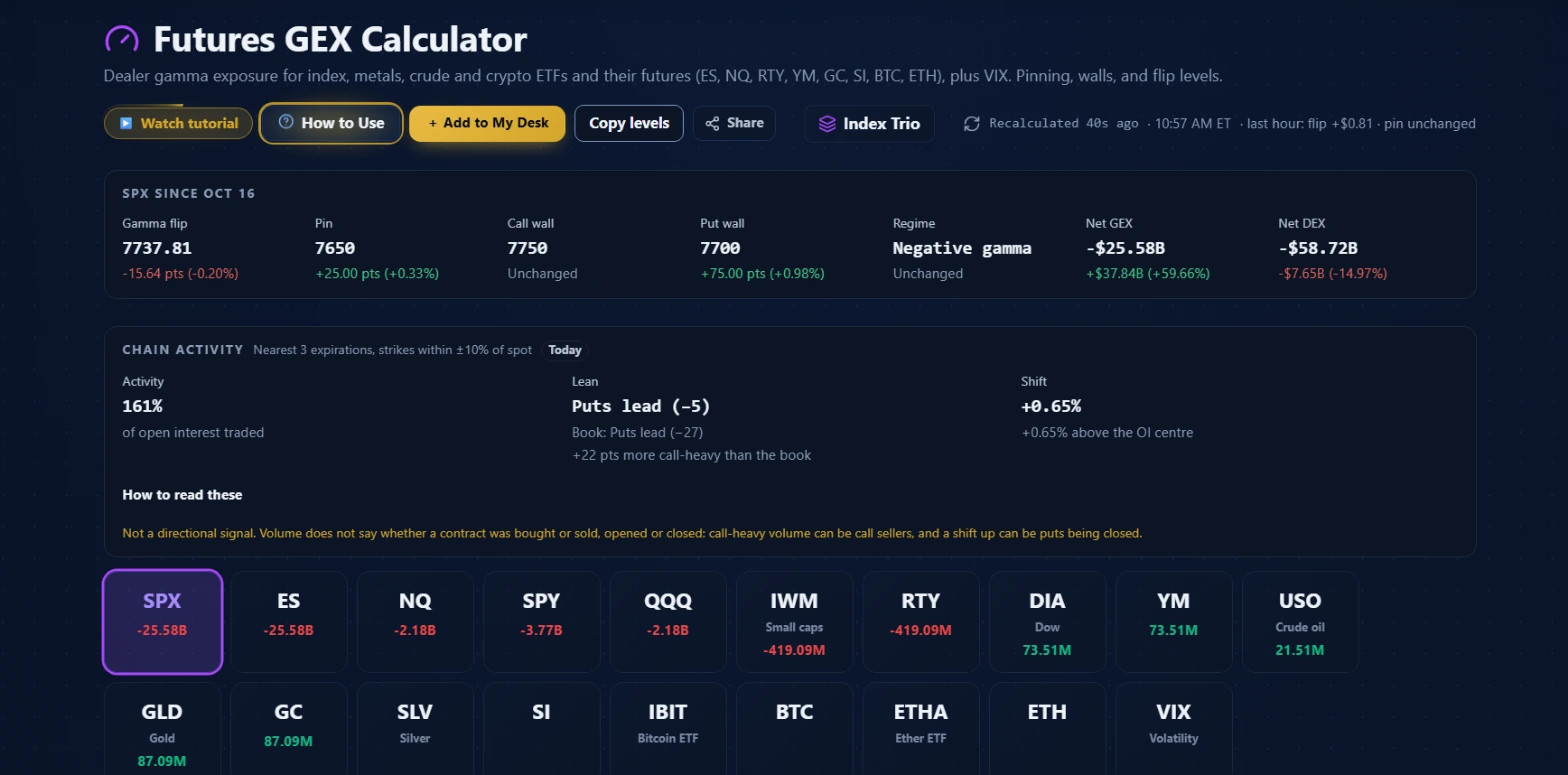 The page on October 19, 2026 at 10:57 AM ET. SPX is the active symbol. The levels strip shows changes since October 16. Chain Activity is below it, followed by the 19-symbol grid.
The header row
Across the top of the page are five action buttons: Watch tutorial, How to Use, Add to My Desk, Copy levels, Share, and Index Trio. To the right sits a recalculation timestamp. On October 19, the page read "Recalculated 40s ago · 10:57 AM ET · last hour: flip +$0.81 · pin unchanged." The timestamp tells you when the last computation ran. The one-hour change notes tell you at a glance whether the key levels are stable or drifting. A flip level that moved $0.81 in the last hour is behaving differently from one that has not moved at all.
Copy levels copies the current symbol's key levels to your clipboard in a format you can paste into pre-market notes or a trade journal entry. Share generates a shareable snapshot. Index Trio opens a compact three-panel view showing SPX, QQQ, and IWM side by side, useful when you want a quick cross-index regime comparison.
The since-date levels strip
Just below the header is the levels strip. On October 19, it read "SPX SINCE OCT 16" and showed seven columns: Gamma flip, Pin, Call wall, Put wall, Regime, Net GEX, Net DEX.
Each column shows the current value plus the change since the since-date. On October 19:
- Gamma flip: 7737.81, down 15.64 points (-0.20%) since October 16. The flip level drifted slightly lower over the period.
- Pin (also called Max Gamma Strike or Magnet elsewhere on the page): 7650, up 25 points (+0.33%). This is the strike with the highest absolute GEX concentration. When price approaches this strike, dealer flow tends to be densest, and reactions are more common here than at surrounding strikes.
- Call wall: 7750, unchanged. A stable call wall means dealer positioning is concentrated at that strike and unlikely to shift before the relevant expiration.
- Put wall: 7700, up 75 points (+0.98%). The put wall moved up toward spot over the period, narrowing the distance between spot and the nearest structural support level.
- Regime: Negative gamma, unchanged. The page had been in a negative GEX regime since at least October 16.
- Net GEX: -$25.58B, up $37.84B (+59.66%) from October 16. Less negative than before, meaning the amplifying regime moderated somewhat over the period without flipping positive.
- Net DEX (Net Delta Exposure): -$58.72B, down $7.65B (-14.97%). DEX tracks the aggregate directional delta of all open contracts at the dealer level. A large negative DEX means dealers are net short delta and need to buy the underlying to hedge, which is structurally a buying flow.
The since-date strip is where I spend the most time in my pre-market read. Levels that have not moved in several days are meaningful structural anchors. Levels that drift significantly between sessions are less reliable as intraday targets. When both the call wall and put wall hold steady for three or four sessions, the market is respecting that structure.
Chain Activity
Below the levels strip is the Chain Activity panel. On October 19, it showed: nearest 3 expirations, strikes within plus or minus 10% of spot, and the Today toggle selected.
Three metrics appear:
Activity: 161% of open interest traded. This is the ratio of volume to open interest across the measured strikes and expirations. Above 100% means more contracts traded that day than exist as open interest, a sign of significant rolling or repositioning.
Lean: "Puts lead (-5)". The raw book reading was "Book: Puts lead (-27)" with a note "+22 pts more call-heavy than the book." The lean compares where today's volume concentrates versus where the existing open interest sits. A call-heavy flow day inside a put-heavy book means call buyers are accumulating relative to the existing positioning structure.
Shift: +0.65%, above the OI centre. The shift shows whether the volume-weighted strike of today's trades sits above or below the OI-weighted centre of all open contracts.
The disclaimer on the panel reads verbatim from the page: "Not a directional signal. Volume does not say whether a contract was bought or sold, opened or closed: call-heavy volume can be call sellers, and a shift up can be puts being closed."
That disclaimer is there because chain activity data is genuinely ambiguous. Call volume on a given strike could mean calls being bought by a bull, calls being sold by a covered writer, or calls being closed by someone exiting a long position. The same volume number means different things depending on who the aggressor was, and the chain data does not carry that information. Use Chain Activity to understand how much repositioning is happening and at which strikes, not as a directional read.
The symbol grid
Below Chain Activity is the full symbol grid. On October 19, it showed 19 symbols across two rows: SPX, ES, NQ, SPY, QQQ, IWM, RTY, DIA, YM, USO, GLD, GC, SLV, SI, IBIT, BTC, ETHA, ETH, and VIX. Each tile shows the symbol name, a short description, and the current Net GEX.
From October 19: SPX at -$25.58B, ES at -$25.58B (same underlying, different units), NQ at -$2.18B, SPY at -$3.77B, QQQ at -$2.18B, IWM at -$419.09M, RTY at -$419.09M (same underlying as IWM), DIA at $73.51M (positive GEX), YM at $73.51M (same underlying as DIA), USO at $21.51M, GLD at $87.09M, GC at $87.09M.
A few relationships that matter:
ES is derived from the SPX options chain. ES is the S&P 500 futures contract, but its GEX levels are computed from SPX options and then scaled by the live ES-to-SPX ratio. Use SPX if you trade SPX options; use ES if you trade S&P 500 futures. They represent the same structural levels in different price units.
NQ is derived from the QQQ chain. NQ shows the QQQ gamma structure mapped to Nasdaq futures price levels. Use QQQ for Nasdaq ETF options; use NQ for Nasdaq futures.
RTY is derived from IWM, YM from DIA, GC from GLD. Each futures proxy tab uses the corresponding ETF's options chain with a live ratio applied. The page never hardcodes the ratio; if it is not available for a session, the tab says so.
USO is a native tab, not a CL futures proxy. Crude oil futures have a drifting relationship to USO because USO holds rolling front-month contracts and bleeds basis in contango. There is no reliable live ratio that maps USO to spot crude, so the tool shows USO's own options chain directly. The strikes shown are USO option strikes.
VIX is native. VIX futures trade at a term-structure premium or discount to the VIX index that changes by the day and by the month. The tab shows VIX index option strikes themselves, not VX futures levels.
Click any tile to switch the active symbol. Everything below the grid updates for the selected symbol.
The expiry selector and Standalone vs Cumulative
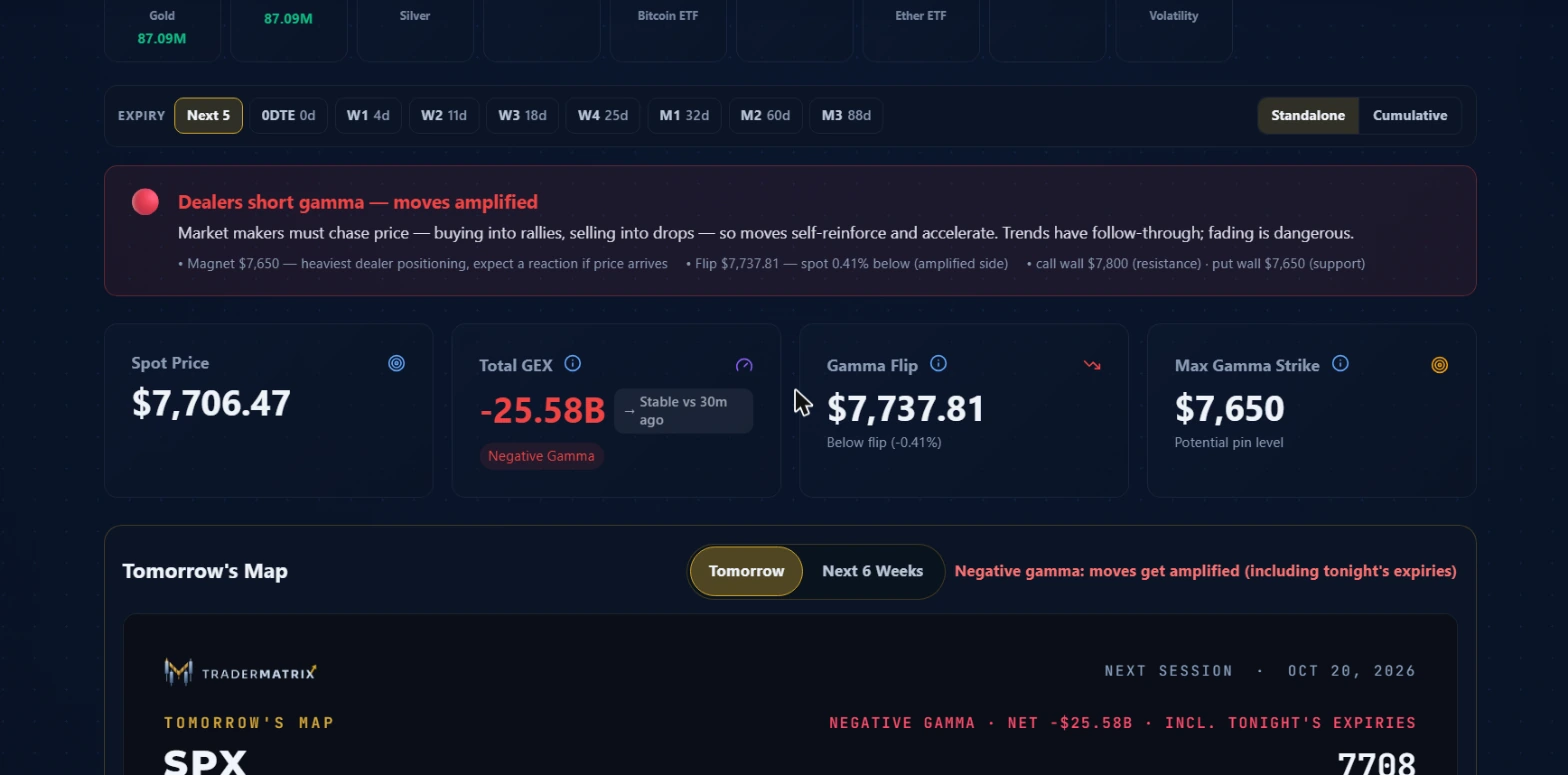 Below the symbol grid: the expiry selector with Standalone and Cumulative toggle, the regime banner, the four stat cards, and Tomorrow's Map. SPX on October 19 at 10:57 AM ET. Spot at $7,706.47, below the gamma flip of $7,737.81.
Below the symbol grid is the expiry selector: Next 5, 0DTE, W1, W2, W3, W4, M1, M2, M3. On October 19, the days-to-expiry labels read: 0DTE 0d, W1 4d, W2 11d, W3 18d, W4 25d, M1 32d, M2 60d, M3 88d.
These filters isolate the GEX structure from a specific expiration bucket. Next 5 (the default) includes the nearest five expirations, which captures the bulk of liquid short-dated positioning without noise from very far-dated contracts. 0DTE is same-day only. W1 through W4 are weekly expirations. M1 through M3 are monthly expirations.
To the right of the expiry chips are two toggle options: Standalone and Cumulative. Standalone shows the GEX from only the selected expiration. Cumulative adds everything from the selected expiration through all earlier expirations.
The expiry selector is most useful around a specific catalyst. If a macro data print lands on Wednesday, switch to W2 and compare its structure to the Next 5 view. If the W2-only view shows a different call wall or flip level than the composite, the Wednesday expiry has its own concentrated positioning that matters specifically for that catalyst day. Strike selection for a play around that event should reference W2, not the broader composite.
On a quiet day with no scheduled catalyst, the Next 5 default is sufficient.
The regime banner
Below the expiry selector is the regime banner. On October 19, it showed a red circle with "Dealers short gamma -- moves amplified" and a one-paragraph explanation: "Market makers must chase price -- buying into rallies, selling into drops -- so moves self-reinforce and accelerate. Trends have follow-through; fading is dangerous."
Below the description, the banner listed three summary points:
- Magnet $7,650 -- heaviest dealer positioning, expect a reaction if price arrives
- Flip $7,737.81 -- spot 0.41% below (amplified side)
- call wall $7,800 (resistance), put wall $7,650 (support)
The indicator dot color changes with the regime: red for negative gamma (amplifying), different color for positive gamma (dampening), muted for neutral. When the regime is neutral, the text describes the transitional state and notes that both a range day and a trend day are structurally plausible.
The regime banner is the fastest pre-trade check on the page. Before looking at anything else, I read it. On October 19: negative regime, spot below the flip, moves amplified. That framing shapes everything else I do that session.
The four stat cards
Below the regime banner are four stat cards showing the live structural numbers.
Spot Price: The current underlying price. On October 19, $7,706.47.
Total GEX: The aggregate net gamma exposure in dollar terms. On October 19, -$25.58B with a note "Stable vs 30m ago" and a "Negative Gamma" badge below the number. The stability note tells you whether the GEX figure has been moving or holding. A total GEX that is stable over thirty minutes means the structure has settled rather than actively repricing.
Gamma Flip: The price level where net GEX crosses zero. On October 19, $7,737.81 with a note "Below flip (-0.41%)." Spot was 0.41% below the flip, confirming the negative regime. This is the level I watch most closely intraday. When spot crosses the flip, the regime changes, and the session character shifts.
Max Gamma Strike (also called Pin in the levels strip and Magnet in the regime banner): The strike with the highest absolute GEX concentration. On October 19, $7,650 with the note "Potential pin level." When price approaches this strike, dealer hedging activity is densest. Reactions here are more common than at surrounding strikes because the delta-hedging flow concentrates at this point. In expiration weeks, price can get pinned to this strike as dealers aggressively re-hedge every move away from it.
The stat cards are the summary layer after the detailed levels strip. If you have ten seconds before a trade, the flip card and the regime banner give you the two-line read.
Tomorrow's Map
Below the stat cards is Tomorrow's Map. On October 19, it showed two toggle options: "Tomorrow" and "Next 6 Weeks." The Tomorrow view displayed a labeled card for "NEXT SESSION · OCT 20, 2026" with the header "NEGATIVE GAMMA · NET -$25.58B · INCL. TONIGHT'S EXPIRIES."
The panel projects the regime for the next session based on current GEX including options that expire tonight. The note "including tonight's expiries" matters: same-day options roll off each evening and that changes the next morning's GEX picture. On October 19, even after tonight's 0DTE expiry, the projection remained negative gamma.
The red text under the toggle read "Negative gamma: moves get amplified (including tonight's expiries)." When the expected regime for tomorrow differs from today's, the note says so. A switch from negative to positive overnight is worth knowing before you carry a trend trade into the next session.
The Next 6 Weeks view extends the projection across multiple sessions. It is useful for positional trades where you want to see whether the regime is likely to shift over the duration of a multi-week options position.
Two workflows from the page
Pre-session structural read
Before the open, I run through four checks on this page in under two minutes.
First, the regime banner. On October 19: negative gamma. Trend days are structurally supported; fading is expensive.
Second, the levels strip. Where is the flip relative to where I expect the market to open? On October 19, the flip was at 7737.81 and the market had closed in negative GEX territory. Unless pre-market flow changes the picture, the session starts in the amplifying regime. The flip at 7737.81 is the level to watch for a potential regime change intraday.
Third, the call wall and put wall. These define the structural ceiling and floor. On October 19: call wall at 7750, put wall at 7700. A 50-point range with spot at 7706, close to the put wall from above. In negative GEX, the put wall does not function as a guaranteed hold the way it might in positive GEX, but it still marks where dealer buying concentrates on a dip.
Fourth, the Max Gamma Strike at 7650. If price moves toward 7650, dealer flow is heaviest there. I mark it on my chart as a reaction zone to watch.
That four-point check takes about ninety seconds. The rest of pre-market preparation builds on top of that structural layer.
Using the expiry selector around a catalyst
When a macro event lands midweek, the Next 5 composite can dilute the specific expiration that carries the most positioning for that date. If the event is on Wednesday, I switch to W2 and compare its call wall, put wall, and flip to the Next 5 view.
If the W2-only structure shows materially different levels than the composite, I know the Wednesday expiry has its own positioning that dominates for that catalyst. Position sizing and strike selection for a Wednesday play reference the W2 structure. If W2 shows a call wall 30 points below the composite's call wall, the Wednesday chain has sold calls at a lower level than the broader market, and that is where the resistance concentrates.
This same approach works for single-name options around earnings. Switch to the expiry that aligns with the earnings date and compare it to the composite. Divergences between the two are where the earnings-specific positioning lives.
Pairings
| Tool | What it adds alongside GEX |
|---|---|
| Market Health | Macro regime context. A positive GEX day inside a HIGH market health composite reads differently from a positive GEX day when the composite is ELEVATED. Size accordingly. |
| Unusual Activity | Large sweeps near the call wall or near the flip in positive GEX are structurally significant. The combination of a GEX level read and directional flow is more actionable than either signal alone. |
| Apex Levels | The Apex Levels scanner computes gamma concentration with added proximity scoring across a broader universe of names. Use it when you want more granularity on which specific strikes matter most for a single-name position. |
Common mistakes
Treating the call wall as a guaranteed reversal level
The call wall raises the probability of a fade on a rally. It does not guarantee a reversal. In a negative GEX session, price can punch through a call wall with dealer mechanics amplifying the breakout rather than resisting it. The wall is a scale-out zone in positive GEX and a thesis-invalidation point in negative GEX. It is not a hard stop in all regimes.
Reading the regime once and ignoring it after a news print
The dealer hedging loop does not pause during a data release. It operates on the new spot price after the spike settles. Fifteen to thirty minutes after a CPI print, the new spot relative to the flip determines whether the rest of the session is a range day or a trend day. Re-read the page after the initial reaction settles.
Using SPX GEX for NQ trade decisions without switching tabs
SPX and NQ are correlated but their GEX structures diverge, particularly around semiconductor earnings when NQ carries heavy options positioning that SPX does not. If you are trading NQ futures or QQQ options, look at the NQ or QQQ tab. SPX gives you the macro structural read; NQ gives you the specific structure for the tech-heavy index.
Drawing directional conclusions from Chain Activity lean
The disclaimer on the Chain Activity panel is there because the underlying data is genuinely ambiguous. A "calls lead" reading can mean call buyers are accumulating, or it can mean covered call writers are selling, or it can mean call holders are closing positions. Without aggressor-side data, the lean describes where repositioning is happening, not who is initiating or which direction they intend.
Fading moves in negative GEX
In negative GEX, the dealer hedging loop accelerates moves rather than dampening them. A setup that produces a clean fade in positive GEX can become a compounding loss in negative GEX because the mechanics work against the position. Check the regime before committing to any fade structure.
What the page does not tell you
The GEX Calculator surfaces the structure of dealer positioning. It does not tell you why the structure is the way it is, whether a specific catalyst will override it, or which direction price will go.
A negative GEX regime in negative gamma does not mean the market will sell off. It means that if it sells off, the move will likely be larger than in positive GEX. The regime informs position sizing and stop placement. It does not generate entries.
The since-date changes in the levels strip show how levels have moved but not why. A call wall that shifted 50 points overnight could reflect a large options trade expiring, institutional positioning rolling to a new strike, or something else. The page shows the output of the positioning, not the reasoning behind it.
Tomorrow's Map is a projection based on current positioning. Any large options trade that lands between now and tomorrow's open can change the projected structure. The map reflects what the structure looks like now rolling forward.
For cross-index reads, the Index Trio button gives you SPX, QQQ, and IWM side by side. When two of the three are in negative GEX and one is in positive GEX, you have a split structural picture across market segments worth tracking before you commit to a macro view.
Adding GEX to your session plan
The most practical combination I have found is this page alongside Market Health before the open. Market Health gives you the macro environment; GEX gives you the structural mechanics. Positive GEX inside a healthy macro backdrop means a stable, range-bound session is probable. Negative GEX inside a stressed macro backdrop means both the macro environment and dealer mechanics align for a trend day with potential for acceleration.
The Add to My Desk button pins the GEX page as a tile on your My Desk home. If this is part of your daily routine, having it in your desk layout means it loads with your session without a separate navigation step.
Options trading involves real risk of loss, including potentially more than the amount invested. Nothing in this guide is financial advice; it explains how the tool works and how to read the data it surfaces. Gamma exposure is a structural indicator based on options positioning. It is not a guarantee of any level holding or any regime persisting. Do your own research and manage position sizing accordingly, particularly in negative GEX sessions where moves extend faster than expected.