
Signal Scanners deep dive · 19 min read
How to Read the Gap Continuation Scanner
A complete walkthrough of the Gap Continuation Scanner on TraderMatrix: what makes a gap hold versus fade, how the opening-range break is confirmed, what the A through D grade actually measures, and how to build a same-day routine around the three confirmation signals.
Open the tool →Hey guys, Art from TraderMatrix here. We're going to walk through the Gap Continuation Scanner, which lives at /gap-continuation-scanner under Find Setups. This one rewards a careful read because the concept sounds simple on the surface, but there are enough moving parts in how it actually works that a shallow understanding will leave you using it wrong.
The short version: some stocks gap at the open and immediately fade, price reverses back toward yesterday's close within the first hour. Others gap and keep going. The scanner identifies names from the second group, the ones that have already proved their gap is holding, and then cross-references three independent signals to see if the conditions support continuation. Each signal that agrees adds one point to a grade. Grade A means all three agree. Grade D means none of them do.
That's the idea. Now let me explain what's actually happening under the hood.
The short version:
- The scanner finds stocks that gapped at least 2%, built a 15-minute opening range, and closed a bar past that range in the gap's direction.
- Each confirmed name is graded A through D by how many of three signals agree: dealer positioning (GEX), options flow, and sector flow.
- Grade A means all three confirm. Grade D means none do. Grade D is not a fade signal.
- The EARNINGS badge flags names where the gap came from that morning's report; earnings gaps carry higher IV and wider intraday ranges.
- Check the chart before acting on any card. Outlier data can pass the price filters, as the CTVA example below shows.
What a gap is and why most of them fail
A gap happens when a stock opens at a materially different price from where it closed the previous session. The open is higher (gap up) or lower (gap down), and there's a visible space on the chart between yesterday's range and today's open.
Gaps happen for all kinds of reasons: earnings, an analyst upgrade or downgrade, a sector catalyst, a macro print before the open. For stocks with $2 billion or more in market cap (the universe this scanner watches), gaps of 2% or more usually arrive with some catalyst attached.
The question a gap raises is always the same: is this the start of a real directional move, or is it an overreaction that will fade back? Money flows both ways on every gap. Some participants are chasing the move, buying a gap up because they think the catalyst is real. Others are selling into it, betting the initial reaction was too aggressive and that price will return to its prior range. The first 15 minutes of the session is the negotiation between those two groups.
That first 15 minutes forms the opening range. It's a specific thing: the high and low from 9:30 to 9:45 AM Eastern. Once that range is established, you have a reference. If the stock later closes a bar above the opening range high on a gap-up day, buyers won that negotiation. That's continuation. If it closes below the opening range low on a gap-up day, sellers won and the gap is fading.
Most gaps fail by this definition. The open produces excitement, early buyers get trapped, and price works back toward the prior close. The scanner filters for the exceptions.
Key point: The opening range is the 9:30 to 9:45 AM window. A bar must CLOSE past that boundary to count. An intraday wick that pulls back inside does not register as a break.
How the scanner builds its universe
The scan starts with every common stock on major US exchanges (NYSE, NASDAQ, AMEX) meeting a basic quality screen: primary listing only, market cap above $2 billion, price above $2, average daily volume above 300,000 shares. Then it filters for any name that gapped at least 2% in either direction that day.
Both gap-up and gap-down candidates go into the pool. From there, the scanner checks each one against the opening range.
The definition of "broke" matters here: the scanner requires a bar to CLOSE past the opening range boundary, not just touch it. An intraday high above the opening range high looks like a breakout on a chart, but if price pulls back and the bar closes inside the range, the breakout didn't hold. The scanner requires a close. That close is exactly what shows up in the "broke $X" field on every card.
Watch out: A wick above the range high is not a break. The "broke $X" price on every card is the close of the first bar that fully cleared and held the boundary, nothing else.
There's one more gate: the break has to agree with the gap's original direction. A stock that gapped up but then closed a bar below the opening range low is a fade. It doesn't appear here. Only names where the opening-range break and the original gap are pointing the same direction make it to the grading step.
By the time anything shows up on this page, three things have already been confirmed in the price data: the name gapped at least 2%, the opening range formed, and a bar closed past that range in the gap's direction. The grade is then assigned on top of that.
The three confirmation signals
Every name that clears the price filter gets checked against three independent signals. Each one either confirms the gap's direction or it doesn't. The total number of confirmations sets the grade.
Dealer positioning
The first check is gamma exposure, specifically whether the ticker is in short gamma or long gamma at scan time. This pulls from the same GEX data that drives /gex.
Short gamma means market makers who sold options need to hedge by moving in the same direction as price. When a stock rallies, short-gamma dealers buy more. When it falls, they sell. That creates mechanical pressure behind the move, which is why short-gamma environments tend to produce more trending and sharper continuation after a breakout.
Long gamma flips the dynamic. Dealers hedge by fading the move: buying dips, selling rips, which dampens swings and pulls price back toward the center of the range. Long gamma environments favor fade candidates, not continuation plays.
When dealer positioning confirms on a card, it means the ticker is in short gamma right now. The direction of the gap doesn't change that check: short gamma amplifies moves regardless of whether they're up or down. This is the most mechanical of the three confirmations.
Key point: Short gamma means dealer hedging amplifies price moves. Long gamma means it dampens them. This is a math outcome, not a market participant opinion, which is why it's the most reliable of the three signals.
If GEX data isn't available for a particular ticker at scan time, the field returns null rather than false. Both null and false fail to add a confirmation point, but they mean different things: null is "no data," false is "we checked and it contradicts." The grade is conservative either way.
Options flow
The second check is whether the live options tape for that name leans in the same direction as the gap. This draws on the same flow data that feeds /live-flow and /unusual-activity.
For a gap-up name, the scanner looks for a bullish flow bias above the platform's conviction threshold. For a gap-down name, it looks for bearish bias with sufficient conviction. A "balanced" reading, where neither side dominates, doesn't count as a confirmation even if there's heavy volume on both sides.
The conviction threshold matters. Thin flow doesn't confirm anything; it takes a meaningful directional skew in the options premium to register. When flow confirms on a card, the options tape had clear directional conviction, not just elevated activity.
Sector flow
The third check is whether the ticker's sector is net-flowing in the same direction as the gap. This uses sector-level premium snapshots from /sectors: if bullish premium exceeds bearish premium in that sector, it confirms a gap-up name; if bearish exceeds bullish, it confirms a gap-down.
Sector flow is the most persistent of the three signals. It reflects activity across all names in a given sector, which makes it slower to change during the session than single-stock flow. That's useful context: a semiconductor stock gapping up while the semiconductor sector is broadly bullish looks different from one gapping up alone while its peers are getting sold. The sector confirmation adds breadth to the read.
Because sector flow is a longer-window signal, it can reflect prior-session positioning as much as same-day conviction. When it's the only signal confirming on a card, I weigh it less than if dealer or flow is also behind the name.
The grade
Three signals. Each confirmed one adds a point. That determines the letter.
| Grade | Confirmations | What it means |
|---|---|---|
| A | 3 of 3 | Dealer, flow, and sector all agree |
| B | 2 of 3 | Two signals confirm, one neutral or absent |
| C | 1 of 3 | One signal confirms, two don't |
| D | 0 of 3 | Nothing confirms the move |
Watch out: Null and false are graded identically. Whether the data was unavailable or actively contradicted the move, neither adds a point. Grade A requires all three to actively confirm, not just none to disagree.
A few things worth being specific about.
The grade is not a pass/fail. A grade D name is on this page because it gapped at least 2% AND closed a bar past its opening range in the gap direction. That's a real price event. Grade D means none of the three contextual signals agree with it at scan time. The gap happened; the context is absent.
Null and false are treated identically for the grade. Whether a signal returned no data or actively contradicted the move, it doesn't add a point. That makes grade A mean "all three actively confirmed," not "nothing was against it."
The page, from top to bottom
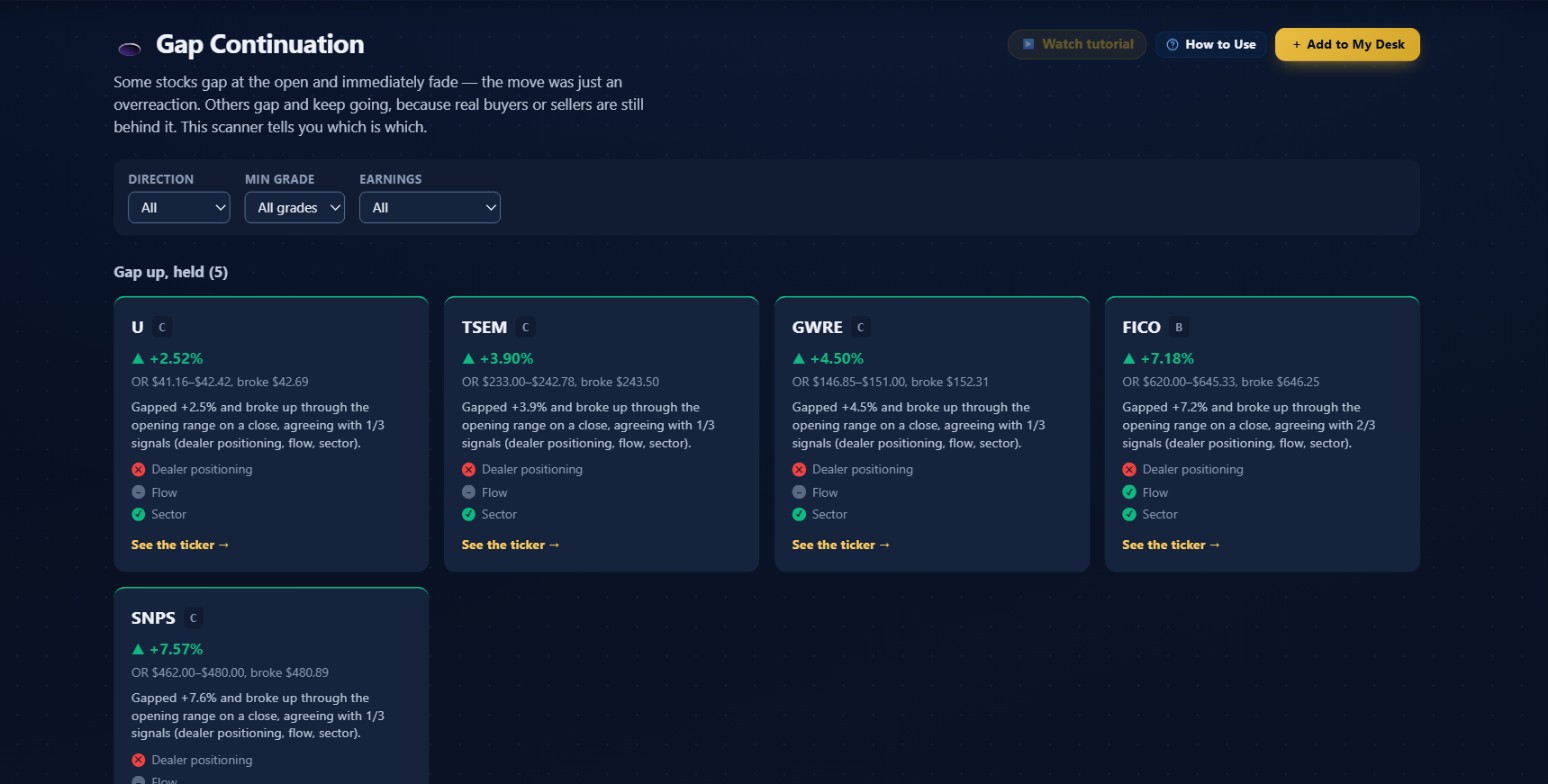 October 1, 2026 after the close. Five gap-up continuations and five gap-down continuations on the board.
The header
The page opens with "Gap Continuation" and a blurb that captures the core idea: some stocks gap and fade, others gap and keep going, and the scanner tells you which is which. Below the blurb are three buttons: Watch tutorial, How to Use (opens a sidebar guide), and Add to My Desk.
The filters
Three dropdowns let you narrow the results.
- DIRECTION: All, Gap up, or Gap down. If you only trade long, filtering to gap up keeps the list focused.
- MIN GRADE: All grades shows everything. A only is the highest-conviction names. A or B removes grade C and D. A, B or C excludes only the zero-confirmation names.
- EARNINGS: All, Earnings only, or Exclude earnings. More on the earnings tag below.
These filters work on the existing results. If you set Min Grade to A and see nothing, that means no name cleared all three signals on that particular day, not that the scanner failed to run.
The two sections
Results appear in two sections: "Gap up, held (N)" and "Gap down, held (N)." The count in the parentheses updates when you change filters. A section only appears when there are results to show.
Reading a card
Each card carries the full picture for one play. From the top: ticker symbol and a grade letter chip. Names from an earnings report get a separate EARNINGS badge and a different card background color.
Below that: the gap percentage with a triangle indicator (green for up, red for down), and the opening range data in the format "OR [low]-[high], broke [price]." The low and high are the first 15-minute bar's range. The "broke" price is the close of the bar that first cleared the boundary, which is the specific close that triggered the confirmation in the scanner.
Then the why text: an automatically generated sentence from the scan data. For example: "Gapped +2.5% and broke up through the opening range on a close, agreeing with 1/3 signals (dealer positioning, flow, sector)." The fraction in that sentence maps directly to the grade: 1/3 = C, 2/3 = B, 3/3 = A, 0/3 = D.
Then three rows: Dealer positioning, Flow, and Sector, each with a glyph. Green checkmark for confirmed, red X for not confirmed, grey dash for null or unavailable. Colorblind readers can read the glyphs without relying on the color alone.
Finally, a "See the ticker" link to the full ticker detail page for that name.
Worked examples from October 1, 2026
That session had five gap-up continuations and five gap-down continuations. Here are the ones worth walking through in detail.
FICO (B, +7.18%)
FICO is the strongest gap-up name on the board by grade. It gapped up 7.18%, forming an opening range of $620.00 to $645.33, then closed a bar at $646.25. That's the break price. Two of three signals confirmed the bullish direction: the why text reads "agreeing with 2/3 signals." Grade B.
A 7% gap holding above a wide opening range with two signals behind it is a meaningful setup. The gap itself absorbed a lot of potential supply before the ORB break even fired. Grade B tells you the context is supportive, not unanimous.
U (C, +2.52%)
Unity Software gapped up 2.52%, opening range $41.16 to $42.42, broke above at $42.69. One signal confirmed, hence the C grade. That's the minimum to grade something above D. U cleared the price filter, but two of three contextual signals weren't behind it at scan time. Worth pulling up the ticker page for more context rather than acting on the card alone.
SNPS (C, +7.57%)
SNPS is the last card in the gap-up section, at the bottom of the first screenshot. It gapped 7.57%, much larger than U, but also grades C with only 1/3 signals. Gap size and grade are independent. A bigger gap doesn't mean more confirmation. That's one of the things the scanner makes explicit in a way a simple sorted list of gap percentages wouldn't.
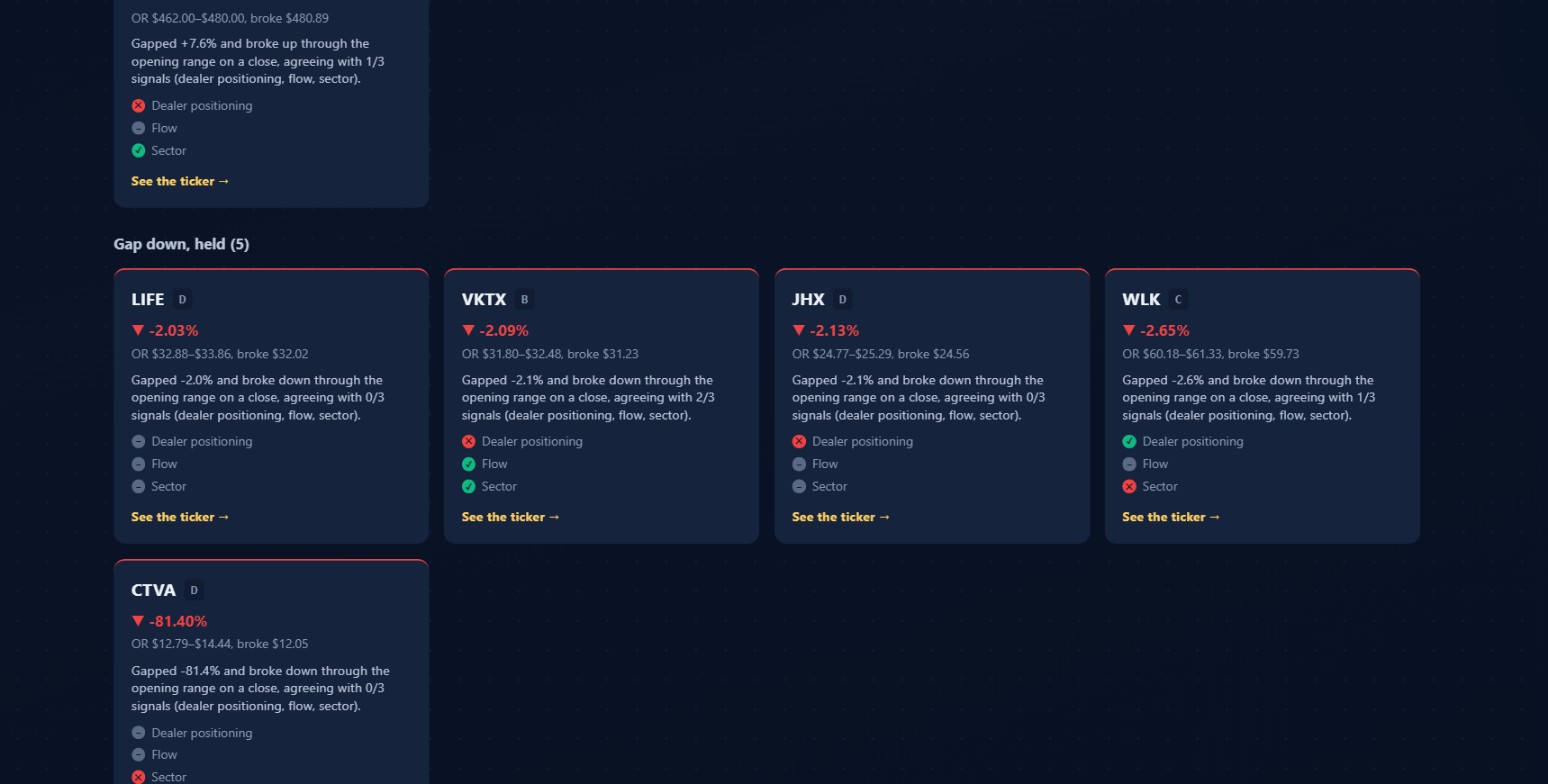 The five gap-down continuations from the same session. VKTX at grade B is the standout on this side. CTVA at -81.40% is the outlier to check before acting on.
VKTX (B, -2.09%)
On the gap-down side, VKTX is the strongest by grade. It gapped down 2.09%, opening range $31.80 to $32.48, and closed a bar at $31.23. Two of three signals confirmed the bearish direction. Grade B. Whatever pushed the stock down pre-market had enough institutional follow-through to register in two of the three confirmation checks.
CTVA (D, -81.40%)
Then there's CTVA. The card shows -81.40%, opening range $12.79 to $14.44, break at $12.05. Grade D, zero confirmations.
The -81.40% figure is almost certainly a data quality problem. Corteva is an agricultural chemicals company with roughly $20 billion in market cap. An 81% gap down would be among the most significant financial events in the entire market that day, and it clearly was not. What likely happened: a feed anomaly, a comparison against an incorrect prior close, or a corporate action that changed the reference price without the stock actually moving 81%.
The scanner passed CTVA through the filters because the raw numbers technically met the criteria. Grade D is at least partially fitting: zero signals confirmed, which is what you'd expect on a phantom move. But the -81.40% alone should stop you before treating this as a short setup.
Try this: Before acting on any card, open the chart and confirm the opening range and break price look plausible. CTVA is the reason this step is never optional. The chart is always the final sanity check.
This case is worth understanding because outliers like this happen occasionally in any scanner that ingests live price data at scale. Pull up the CTVA chart and it shows normal trading in the $14 range.
The earnings tag
Any name on the scanner can carry an EARNINGS badge. It means the gap was caused by the stock's own earnings report: either a before-market-open (BMO) report that morning, or an after-market-close (AMC) report from the previous session that the market is now reacting to.
The detection is specific: only a BMO report that same morning or an AMC report from the prior session qualifies. A gap three days after an earnings report doesn't get tagged as earnings-related, because by then any move has a different cause. The scanner cross-references an earnings calendar with that precise rule.
Earnings gaps behave differently in a few ways worth noting. Implied volatility is typically elevated around earnings, so options premiums are higher and the opening range tends to be wider than on non-earnings days. The stock also has a fundamental catalyst behind the move, not just a technical or flow-driven one.
The EARNINGS filter in the filter bar lets you isolate these or exclude them. Set it to "Exclude earnings" if you want only catalyst-free gap continuations. Set it to "Earnings only" if you're specifically looking at earnings momentum plays.
One sizing consideration that comes up regularly: earnings gaps can have larger intraday ranges than catalyst-free gaps because the market is still processing the news and IV remains elevated. Treating an earnings-gap trade the same way as a non-earnings continuation, same size, same spread width, tends to work against you when the stock swings more than expected. The stop-out distance is further from entry, and the position size should reflect that.
Building a session routine around this
This is a same-day, early-session tool. The opening-range break is a same-day momentum signal, and the most actionable window is before price has had hours to consolidate.
When building a morning game plan, this scanner fits in after checking the market-level context: what SPY and QQQ are doing, whether the broader backdrop is risk-on or risk-off. Then I look at what grades are on the board.
If there are grade A names, those are my first stops. Unanimous signal support is uncommon and worth a chart check. I want to know: is the price still above the opening range high (for a gap up)? Has it extended since the scan fired, or is it pulling back to retest the ORB? A retest of the opening range boundary after the initial break is often a cleaner entry than chasing the first thrust.
Try this: On a grade A or B name, watch for a retest of the opening range boundary after the initial break. Buying a retest that holds is often cleaner than chasing the opening thrust.
For grade B names, I look at which two signals confirmed. Dealer positioning and flow both confirming means the mechanical and the tape agree. Sector flow confirming without those two is a broader, less specific read. Not useless, but I weigh it differently.
Grade C names go on a watchlist. They cleared the price filter but have minimal signal support. Sometimes a C-grade name becomes interesting later when fresh flow shows up on /live-flow or a standout print hits /unusual-activity. I don't treat a grade C card as an action signal on its own.
For the gap-down side: same logic, opposite direction. A grade B gap-down with two signals confirmed in the bearish direction is a setup worth examining. A grade D gap-down with zero signals behind it isn't worth trading directionally from this data alone.
What "held" actually means
The section headers say "Gap up, held (N)" and "Gap down, held (N)." The word "held" is doing more work than it looks.
"Held" means this happened in sequence: the stock gapped at least 2% at the open, built an opening range during the first 15 minutes, then closed a subsequent bar past the range boundary in the gap's direction. The break has to agree with the original gap direction. A stock that gapped up but then closed a bar below the opening range low is a fade. It doesn't show here even though it technically broke the range.
This is why a name might appear on the page already looking extended. SNPS on October 1 was already up 7.57% by the time the scan ran. You're seeing it not as an early alert but as a confirmation that the move cleared the opening range. Whether there's more to go is what the grade helps you think about.
How it pairs with other tools
Each of the three confirmation signals has a corresponding page where you can see more.
- Dealer positioning confirms: Open /gex for that ticker. The full gamma exposure chart shows which strike levels carry the most exposure, the current regime in detail, and whether there's a nearby level that might slow the move.
- Flow confirms: Check /live-flow and look at the ticker's card. You'll see the full session premium split: how much went bullish versus bearish, trade count, and the biggest single print. /unusual-activity shows whether the confirmation came from one large standout print or broader accumulation.
- Sector flow confirms: Go to /sectors and look at the ticker's sector. A sector at 70%+ bullish is a different environment for a gap-up name than one sitting at 52%. Sector Flow shows the weight behind the direction.
- Dark pool check: /dark-pool is worth a quick look on any grade A or B name. Block prints are a different data stream from options flow, and when both align with a gap continuation, that's converging evidence from two independent sources.
Common mistakes
-
Treating grade D as a fade signal. It isn't. Grade D means zero of the three confirmation signals agreed with the gap direction at scan time. It says nothing about whether the gap will reverse.
-
Entering without looking at the chart. The scanner writes whatever the numbers show, including outliers like the CTVA -81.40% case. Before acting on any card, pull up the chart and verify that the opening range and break price match what you can see. If the numbers look implausible, they are.
-
Ignoring the broader market when sizing. A grade A gap-up in a single stock on a day where SPY is selling off hard has a much harder time extending. Check the index direction before committing to a full-size position. A strong individual setup in a weak tape is worth smaller size or waiting for a confirming candle.
-
Using this as a swing trade trigger. These signals reflect conditions from the opening session. The opening-range break is a same-day momentum signal. Structure and size should reflect that horizon.
Watch out: Gap size and grade are independent. SNPS gapped 7.57% and graded C with 1/3 signals. A bigger percentage does not mean more confirmation from the three-signal system.
What separates this from the other scanners
The Gap Continuation Scanner is the only one on the platform that requires the breakout to have already happened before anything shows up. Most scanners identify setups that might lead to a breakout. This one requires the breakout to have occurred and held.
Breaking Out watches for developing technical breakouts across the session, not specifically opening-range breaks after a gap. Reversal Finder is built around a dumb-money composite looking for oversold conditions with potential bounce setups, which is the opposite of momentum continuation. Earnings Flow focuses on options positioning heading into earnings events, not post-earnings price behavior.
Gap Continuation is built around one narrow thing: a stock gapped, the range formed, a bar closed past the range in the gap's direction, and these three signals do or don't agree. Narrow tools with clear definitions are easier to use correctly.
One question I haven't fully answered yet: does the grade quality correlate differently with performance depending on which specific signal is confirming? A grade B where dealer positioning is the missing confirmation versus a grade B where sector flow is the missing confirmation could behave differently in the price data. That's worth watching over time as you build experience with how each combination tends to play out.
Nothing here is investment advice. Trading carries real risk and you can lose money. A grade A card means three data signals confirmed a price move at a point in time. It says nothing about what happens in the next hour. Use this as one input in a framework, not as a standalone signal.