Loading...

Markets & Smart Money deep dive · 17 min read
How to Use the CBOE Options Scanner
A plain-language guide to what the CBOE Options Scanner actually tracks: when stocks get listed options for the first time, when names earn weekly expirations, and how to turn that structural feed into a real research routine.
Open the tool →Hey guys, Art from TraderMatrix here. Most of the tools under Options Flow read what's already happening in the options market: who's buying calls, where big premium is landing, how flow distributes across sectors. The CBOE Options Scanner does something structurally different. It watches for changes to the options market itself, specifically when a stock gets listed options for the first time, and when a name gets promoted to weekly expirations.
That sounds narrow. It isn't. The moment a new options chain comes into existence is one of the few genuinely structural signals in this space. It changes what's possible to trade on a name and who can participate in it. This walkthrough covers every part of the page, explains how the underlying comparison actually works, and shows you how to fold the feed into a practical research workflow.
The short version:
- New listings have zero open interest. Every early print is a fresh opener, not a roll or a close.
- Spreads are too wide to trade on day one. Note the name, come back in about two weeks.
- Weekly promotion means the exchange confirmed sustained demand for a more frequent settlement cycle.
- The MWF Elite strip shows 12 names with Mon/Wed/Fri expirations and three 0DTE opportunities per week.
- Use the scan log as a research inbox, then follow confirmed names in Unusual Activity and Live Flow.
What it means when a stock gets options for the first time
Before a stock has any options, there's a threshold it has to cross. The exchange evaluates share price, trading volume, and the size of the public float. Once a name qualifies, an options chain gets listed. That chain starts with a handful of expirations and a set of strikes around the current stock price.
The day before listing: no chain. The day after: dozens of contracts exist, each one a financial instrument that wasn't available 24 hours earlier.
That first day has one property that every subsequent day lacks. Open interest is zero. Every contract traded on a brand-new chain is an opening position. Nobody is rolling an existing trade, nobody is closing a hedge, nobody is adjusting a spread. Every single print in those first days is someone making a fresh decision that this name is worth putting capital into.
That's structurally different from what you see on a mature chain, where any given print could be an opener, a roll, a hedge against shares, or a close of something from three months ago. All of those possibilities coexist in every mature options market. On a new chain, there's only one possibility: somebody is opening.
Key point: On a brand-new chain, every print is an opening position. No rolls, no closes, no hedges against existing stock. That's a cleaner read than almost anything on a mature chain.
That matters for how you interpret early flow on the name. But it doesn't mean you should trade on day one. The opposite, actually. Spreads on freshly listed options are wide, often 30 to 50 percent of the mid-price on near-ATM contracts, because market makers haven't accumulated enough of a price history to quote confidently. Open interest hasn't built yet. The bid you see doesn't represent real liquidity behind it.
The right move is to note the name, put it on a watch list, and come back roughly two weeks later. By then market makers have seen enough trading to tighten their quotes, OI has started accumulating on the key strikes, and fills are closer to mid-price. Discovery signal: day one. Entry signal: typically around day 14.
Watch out: The scanner fires on the day a new chain lists. That's the discovery signal, not the entry signal. Wide spreads and thin OI make day-one fills unreliable. Give the chain roughly two weeks before evaluating it seriously.
What weekly expirations mean and why the promotion matters
Most options chains start with monthly expirations only. The standard cycle runs on a schedule tied to the third Friday of each calendar month. A stock with monthly-only options has roughly 12 expiration dates per year.
A stock earns approval for weekly expirations once the exchange concludes there's enough sustained trading activity to support more frequent settlement. Weekly options expire every Friday. That gives traders significantly more granularity about when a position ends.
That matters differently depending on what you're doing:
- Covered calls: target specific weeks around earnings or technical levels instead of committing to the full monthly date.
- Cash-secured puts: engineer a shorter cycle and collect premium faster.
- Directional trades: size your days-to-expiry more precisely.
- 0DTE: weekly options extend the game from once per month to every Friday. Names with Mon/Wed/Fri expirations give three 0DTE opportunities per week.
The promotion to weekly status means the exchange has decided the demand is real and sustainable. It's a liquidity milestone. A removal from the weekly list carries the reverse message: trading dried up enough that the exchange pulled the approval.
Key point: Weekly promotion is a liquidity milestone. It means the exchange confirmed enough sustained demand for a more frequent settlement cycle. A removal from the weekly list is the reverse verdict.
The page, top to bottom
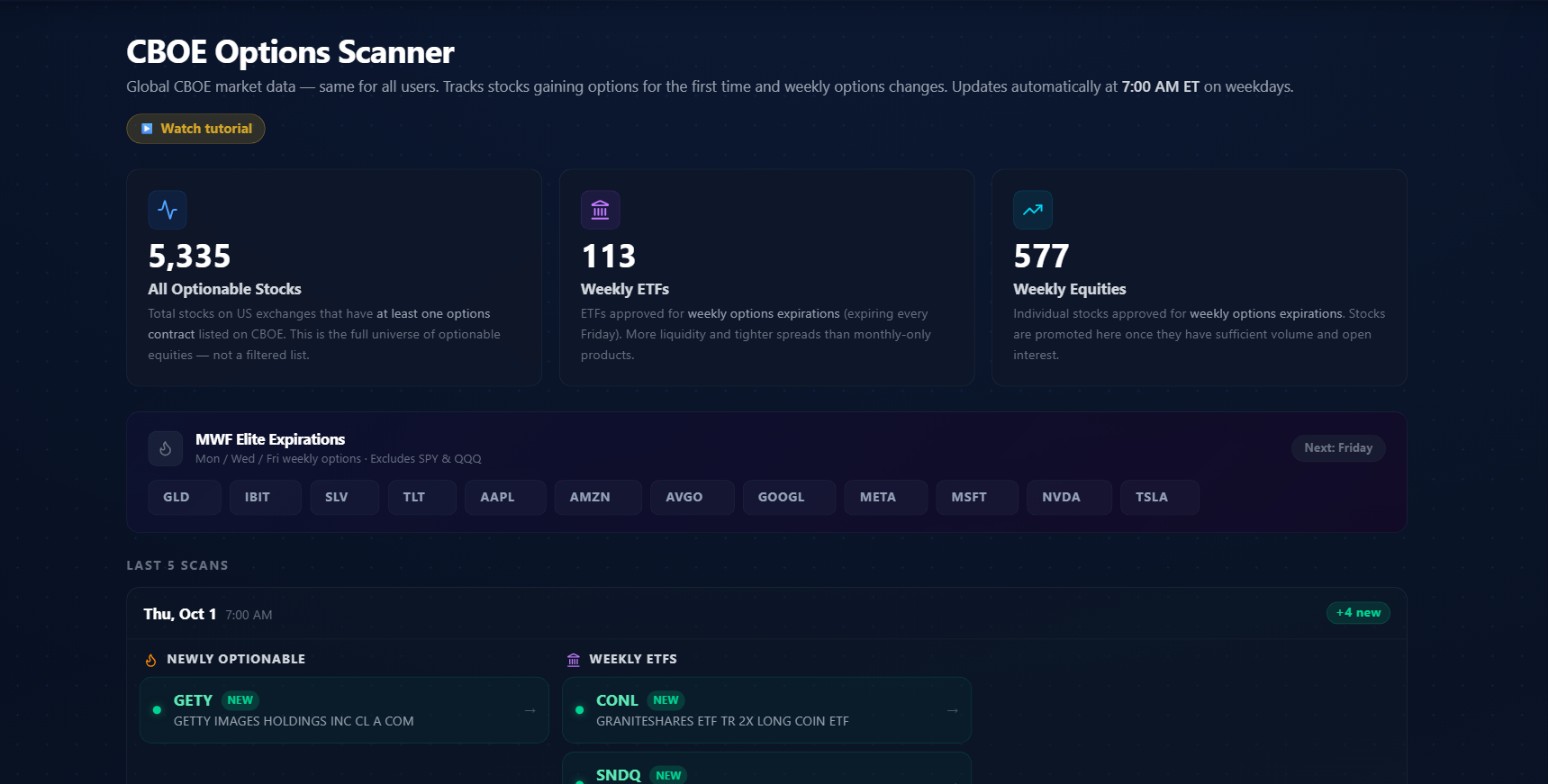 The top of the page from the October 1, 2026 session. Three stat tiles show current universe counts; the MWF Elite strip sits below them; the Last 5 Scans log starts with that day's results.
The page opens with the title "CBOE Options Scanner" and a subtitle confirming what it tracks. There's a Watch Tutorial button just below for the video walkthrough.
Three stat tiles sit across the header:
| Tile | Count (Oct 1) | What it measures |
|---|---|---|
| All Optionable Stocks | 5,335 | Every US-exchange stock with at least one options contract. The complete optionable universe, not a filtered list. |
| Weekly ETFs | 113 | ETFs approved for weekly expirations, expiring every Friday. More frequent trading produces tighter market-maker competition and tighter spreads. |
| Weekly Equities | 577 | Individual stocks promoted once the exchange confirms sufficient volume and open interest for a weekly cycle. |
How the underlying comparison works
The scanner runs a set comparison: the current exchange listing against the last stored snapshot. For the full optionable universe (the 5,335 stocks), it checks which names appear in the current listing that weren't in the previous snapshot. Those are newly optionable. Names that were in the previous snapshot but aren't in the current listing appear as removed.
The same process runs independently for the weeklies, which the exchange publishes in two sections: ETFs and individual equities. New entries in either section show up under their respective category. Disappearances from either section show up as removals.
The diff is a pure set comparison. No scoring, no threshold, no sentiment analysis. If a ticker is in the current snapshot and wasn't in the previous one, it's new. If it was in the previous snapshot and isn't in the current one, it's removed. Every change on this page comes from that comparison. The results get stored in the database after each scan, which is how the Last 5 Scans feed works: each entry is one stored scan result from a specific date.
There's no manual curation. The feed is the output of the diff.
The MWF Elite section
Below the stat tiles is the MWF Elite Expirations box. This surfaces 12 tickers that have Mon/Wed/Fri weekly options, excluding SPY and QQQ.
The full list as of October 1: GLD, IBIT, SLV, TLT, AAPL, AMZN, AVGO, GOOGL, META, MSFT, NVDA, TSLA.
SPY and QQQ are excluded because they already get prominent coverage across the platform. These 12 are the names outside that pair with the densest weekly expiration structure. Mon/Wed/Fri expirations mean three 0DTE opportunities per trading week, not one.
The box is aware of what day it is. On a Monday, Wednesday, or Friday, a pulsing amber dot appears labeled "0DTE Today" and the ticker chips shift to amber. On a Tuesday or Thursday, the box shows "Next: Friday" (or whichever MWF day is upcoming). October 1 was a Thursday, so it showed "Next: Friday."
Try this: On a Monday, Wednesday, or Friday, the amber "0DTE Today" dot appears and all 12 chips shift to amber. That's your quick visual confirmation that 0DTE options are live on every name in the strip. Click any chip to open Ticker Search directly.
Click any ticker in the MWF strip and it opens Ticker Search for that name directly.
The 12 names on this list are hardcoded in the platform's market hours constants. They were chosen because they have the most liquid options markets outside SPY and QQQ. Other names may have weekly expirations but lack the Mon/Wed/Fri cadence.
The scan log
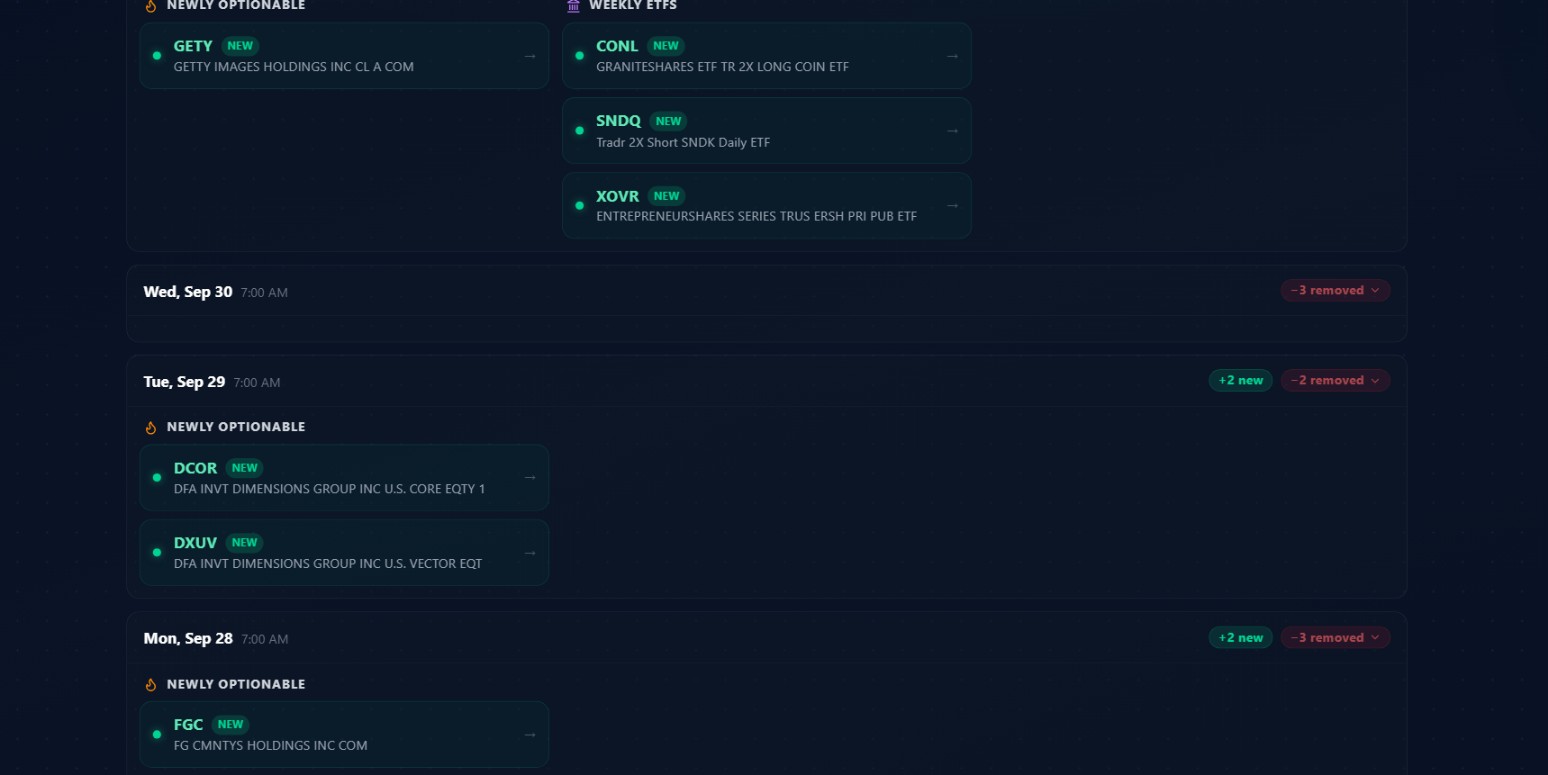 The Last 5 Scans feed scrolled down. Green-bordered cards are additions; collapsed red badges are removals. October 1 shows one newly optionable stock and three new weekly ETFs.
Below the MWF strip is "Last 5 Scans." Each entry represents one stored scan result, labeled with its date. Here's what the October 1, 2026 session showed, newest first:
Thursday, October 1 (+4 new)
Under Newly Optionable: GETY, Getty Images Holdings Inc Cl A Com. A major stock photography and media licensing company getting options listed for the first time.
Under Weekly ETFs: CONL (Graniteshares ETF TR 2X Long Coin ETF), SNDQ (Tradr 2X Short SNDK Daily ETF), XOVR (Entrepreneurshares Series Trus ERSH PRI PUB ETF). Three ETFs gaining weekly expirations on the same day.
Wednesday, September 30 (-3 removed)
Three tickers dropped off. No additions. The removed section collapses by default behind a red badge; you click to expand it.
Tuesday, September 29 (+2 new, -2 removed)
Under Newly Optionable: DCOR (DFA Invt Dimensions Group Inc U.S. Core Eqty 1) and DXUV (DFA Invt Dimensions Group Inc U.S. Vector EQT). Both are Dimensional Fund Advisors ETF products getting their options chain for the first time.
Monday, September 28 (+2 new, -3 removed)
Under Newly Optionable: FGC (FG Cmntys Holdings Inc Com) and BALY (Ballys Corporation Common Stock). Ballys is the casino and gaming company.
Friday, September 25 (+6 new)
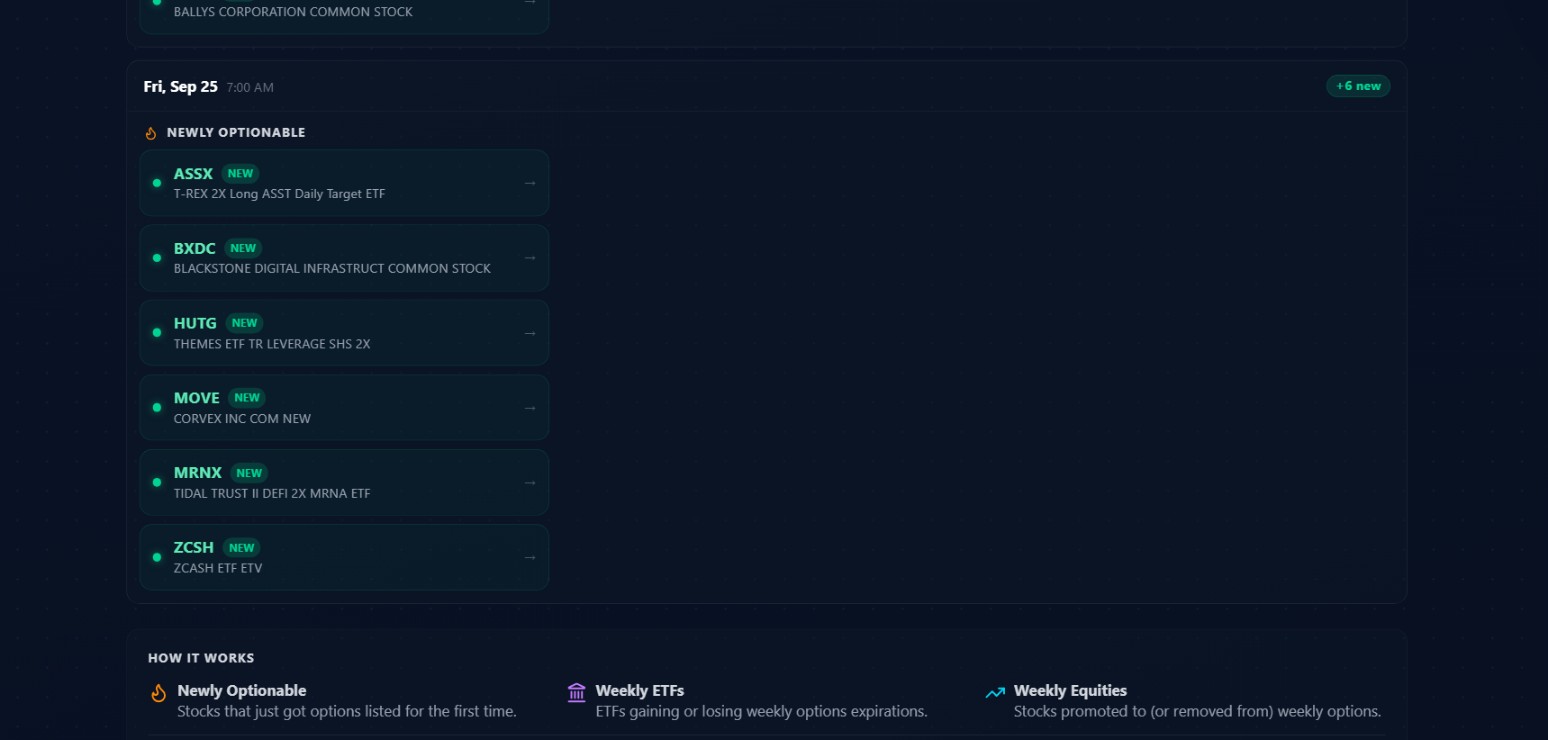 The September 25 batch, one of the busier days in this window. Six newly optionable names in one scan, several of them leveraged ETF products. The How It Works legend appears at the bottom.
Under Newly Optionable: ASSX (T-REX 2X Long ASST Daily Target ETF), BXDC (Blackstone Digital Infrastruct Common Stock), HUTG (Themes ETF TR Leverage SHS 2X), MOVE (Corvex Inc Com New), MRNX (Tidal Trust II DeFi 2X Mrna ETF), ZCSH (Zcash ETF ETV). Six names in one session is on the high end.
Clicking any ticker badge opens its options chain in Ticker Search. The arrow on the right side of each card is the link.
What those 2X and leveraged ETF entries mean
Look across September 25 and October 1 and a specific type of name keeps appearing: products with "2X," "Leverage," or "Short" in their full names. ASSX (T-REX 2X Long ASST Daily Target ETF), HUTG (Themes ETF TR Leverage SHS 2X), MRNX (Tidal Trust II DeFi 2X Mrna ETF), CONL (Graniteshares ETF TR 2X Long Coin ETF), SNDQ (Tradr 2X Short SNDK Daily ETF).
These are single-stock leveraged ETFs. Each one targets a 2x or -2x multiple of one individual stock's daily return. SNDQ aims to deliver the inverse of SanDisk's daily move at 2x magnitude. MRNX aims for 2x exposure to Moderna's daily performance. The leverage resets each session, applied fresh each day.
They appear frequently in this feed because the category has expanded considerably over recent years. Every new product that comes to market goes through the same exchange listing process as any other equity. Appearing in the scanner means options on that leveraged vehicle have just been approved, or it just earned weekly expirations.
Watch out: Leveraged single-stock ETFs appear frequently in this feed. They're synthetic vehicles where the underlying already carries leverage. The research process is different from an operating company like GETY getting its first chain.
The research context is different from a company like GETY (Getty Images) getting its first options chain. With an actual operating company, you have earnings, catalysts, analyst coverage, and institutional ownership to track. With a leveraged single-stock product, you're looking at a synthetic vehicle where the underlying already carries leverage, and adding options on top introduces additional layers. ZCSH (Zcash ETF ETV) from September 25 is another variant: it tracks a cryptocurrency. Same principle. A newer type of product working through the listing process, not a traditional operating business.
What a new listing can tell you about a company
When a real operating business gets options for the first time, the timing usually reflects something specific. A company that recently IPO'd will eventually cross the price and volume thresholds the exchange requires. The day it does, the options market opens for that name.
The first wave of options activity often comes from people who had views on the stock since the IPO but couldn't act through the options market until that moment. Sophisticated traders, funds, and market makers who track the IPO pipeline know when a name is approaching listing eligibility. When the chain opens, early prints are frequently from participants who had a thesis ready.
That's the cleanest version of the "every print is new money" property. On a mature chain, any given print could be anything. On day one, it can only be an opener. Someone decided, that day, that this name was worth a premium payment. That's a cleaner read than the noise-to-signal ratio on any established chain.
The practical implication: note it, track it in Ticker Search, and watch Unusual Activity for that ticker over the following few weeks. When the first significant sweep hits Unusual Activity on a name that just got its chain listed, two things are happening simultaneously: the structural freshness of a chain where all prints are openers, and the behavioral signal of someone placing a concrete bet.
Take GETY, which appears under Newly Optionable on October 1. A name on its first day of listing has no open interest history and no track record for its spreads. Whether it develops into a name worth tracking in Unusual Activity two weeks from now, or stays thin and never gets any institutional attention, is something the scanner can't tell you. You just note it and find out.
Days when nothing changes
Some scan entries will show "stable, no changes." Completely normal. The exchange doesn't list new options chains or promote new weeklies every single trading day. The scanner runs and reports what it finds. When nothing changed, it says so.
Days with many changes tend to cluster. A wave of recent IPOs hitting the listing threshold simultaneously, a batch of new ETF product launches, or an exchange review of weekly eligibility can produce five or six new names in one day. Other days produce nothing. The pace carries no signal.
Using the feed as a research routine
Open the scan log and look at the latest entry. For Newly Optionable names, read the full company name, not just the ticker. Getty Images is a well-known media company. Ballys is a recognizable gaming brand. DCOR and DXUV are institutional ETF products. ASSX and HUTG are leveraged synthetic vehicles. Each of those is a different research situation, and the full name in the card tells you which one you're looking at before you click through.
Names that interest you get added to a personal list with the scan date. After roughly two weeks, open each in Ticker Search and check whether the chain has developed. Look at whether near-ATM options have any meaningful OI on them. Check whether the bid-ask spread on a 30-day contract has tightened to a workable level. If both of those are yes, the chain is maturing.
Try this: Once a chain shows meaningful OI and tighter spreads, bring it into Unusual Activity and Live Flow. A name from this scanner appearing in Unusual Activity means a relatively fresh chain and a real capital commitment are happening at the same time. That combination is more informative than either signal alone.
At that point, bring in Unusual Activity. That page surfaces individual options prints scored by a combination of volume relative to open interest, premium size, spread tightness, and days to expiry. When a name from your watch list starts appearing there, you have two data points agreeing: the structural quality of a relatively fresh chain and the behavioral signal of someone committing real capital.
Live Flow gives you the per-ticker roll-up of the $20k-plus options tape: total premium, trade count, bull/bear split, and the biggest recent print. When a recently listed name starts showing meaningful directional premium building in Live Flow, the chain has developed a personality worth tracking.
Dark Pool covers off-exchange block prints in equities. If a stock just got its options listed and is also showing accumulation lean in the dark pool feed, that's two separate markets pointing the same direction independently. The dark pool activity is in shares; the Unusual Activity is in options. When they agree independently, that agreement carries more weight than either signal alone.
For names that earned weekly expirations, Ticker Search is again the most relevant follow-on tool. Once weeklies exist, you can see how OI distributes across different expirations. Premium sellers focused on covered calls or cash-secured puts will want to see what specific weekly strikes look like now that the weekly cycle is available.
What removals tell you
The removed section collapses by default. Click the red badge and you see which tickers dropped off the relevant lists that scan.
Watch out: A stock losing its options entirely usually means a completed acquisition, delisting, or bankruptcy. The chain closing affects your contracts directly. If you hold a position in a removed name, check immediately.
A stock losing its options entirely is unusual. It typically means something significant: a completed acquisition (the underlying ceased to exist), a delisting, a bankruptcy, or a ticker change where the old symbol was retired. If you hold any position in a name that appears removed from the optionable universe, research immediately. The chain closing affects your contracts directly.
A stock losing its weekly expirations but keeping monthly options is less dramatic. Trading volume dropped below whatever threshold the exchange uses to maintain the weekly cycle. The chain still exists. You just go back to monthly-only. Your existing positions run to their original dates; you lose the ability to target specific weeks in future trades on that name.
Days with only removals, like September 30 with three removals and nothing new, are worth a look even when you don't recognize the names. They tell you the universe contracted slightly that day, and whatever dropped off had a reason.
How this tool fits next to the rest of Options Flow
The CBOE Options Scanner lives under The Market in the navigation, not under Options Flow. That placement reflects what it actually is.
- Unusual Activity: scored feed of individual options prints, each row a single trade that cleared the anomaly threshold
- Live Flow: per-ticker roll-up of the $20k-plus tape, one card per name showing where premium is concentrating
- Heat Map: urgency board of ticker tiles keyed to flow activity
- Dark Pool: off-exchange equity block prints
- Sector Flow: sector-level dashboard of institutional options activity
- Earnings Flow: pre-earnings positioning by name
All six of those read what's happening in existing markets. The CBOE Options Scanner reads when those markets come into existence or change their structure. Infrastructure versus activity.
A name showing up in Unusual Activity that just got its options listed last week is a different situation from the same print appearing in a name with two years of chain history. On the new chain, every print is an opener. On the mature chain, it's a messier mix.
The Ticker Search page is the natural next step after clicking any badge on this scanner. Each ticker badge links directly to Ticker Search, which pulls the full options chain, underlying quote, and any flow or dark pool prints that already exist on the name. For a brand-new listing that's the fastest way to confirm it's still a thin market before committing attention to it.
Common mistakes
Trading day-one chains. The scanner fires on the day a new chain lists. That's the discovery signal. Spreads are too wide that day and typically for the first week. The value is in adding it to your watch list, coming back in two weeks, and checking whether the chain has matured.
Skipping the weekly ETF column. Most people focus on Newly Optionable and treat the Weekly ETFs section as background noise. A specialized ETF gaining weekly expirations can be directly relevant if you trade that product category. CONL earning weeklies on October 1 means you now have a weekly-options vehicle for 2x Coinbase exposure if that fits a thesis you're running.
Confusing the two categories. Newly Optionable means no options existed before. A Weekly Equity or Weekly ETF addition means the chain existed and the expiration structure changed. For a newly optionable name, you're asking whether the company is interesting enough to watch as the chain matures. For a weekly promotion, you're asking whether the new expiration cycle opens up strategies you couldn't run before.
Not expanding the removals section. It collapses by default. Clicking the red badge to see what dropped off takes two seconds. If you have open positions in a removed name, you want to know that day.
Nothing here is investment advice or a recommendation to buy or sell any security. Options trading involves real risk, including losing the entire premium you pay. Research every name thoroughly before trading it.