
Signal Scanners deep dive · 17 min read
How to Read the Breaking Out Scanner
A complete guide to TraderMatrix's momentum breakout scanner: what the five signal types mean, how strength is actually computed, how to read each card, and how to build it into a daily routine using real signals from October 1, 2026.
Open the tool →Hey guys, Art from TraderMatrix here. The tool I want to walk you through today is the Breaking Out scanner, which lives under Find Setups in the nav at /breaking-out. I've been using this one pretty much every day since we built it and it's become a central part of how I find swing trade candidates after the close.
This guide goes through every part of the page, the signal types, how strength is actually computed, and what the cards are telling you, using real signals from October 1, 2026. I'll also be honest about where this kind of signal has limits and how to avoid the mistakes I see most often.
The short version:
- The scanner detects momentum breakouts and continuations using the TraderDaddy Oscillator, not just price change.
- STRONG means seven sub-indicators agree clearly. WEAK means the signal barely crossed the threshold.
- Every card gives you a breakout level: if price closes back below it, the setup is off.
- Filter to STRONG first, then confirm with Unusual Activity and Sector Flow before adding anything to your watchlist.
- The break already happened on the prior candle. Your entry comes from a retest, not the initial spike.
What a breakout is and why it matters
Before we get into the page itself, let me make sure we're on the same page about what a breakout actually is, because the word gets used pretty loosely.
A breakout happens when a stock price closes above a prior resistance level. Resistance is a price zone where the stock has repeatedly failed to move higher, meaning sellers were willing to sell there and buyers couldn't push through. When price finally clears that zone with enough force, the old resistance sometimes becomes new support. The idea is that everyone who was waiting to short at resistance is now trapped, and buyers who missed the initial move want to get in on a pullback to that same level.
Volume is what separates a real breakout from a drift. A price that edges through resistance on thin volume often reverses quickly because there wasn't real conviction behind it. A price that blows through resistance on 2x average volume is a different story. Sellers showed up and buyers overwhelmed them. The scanner specifically looks for that condition, systematically, across a wide universe of tickers every day after the close.
A scan, not a recommendation
One thing to get clear before you start trading off these cards: this scanner detects that the break happened on the prior candle. It doesn't tell you whether to buy. Your job is to decide whether the new support holds, wait for a retest, and confirm the setup with other data before putting capital at risk.
I'll say more about how to actually use the signals later. For now just hold onto that distinction.
Key point: This scanner detects that the break happened on the prior candle. Buying the moment a card appears means buying after the move, not into it.
The page, top to bottom
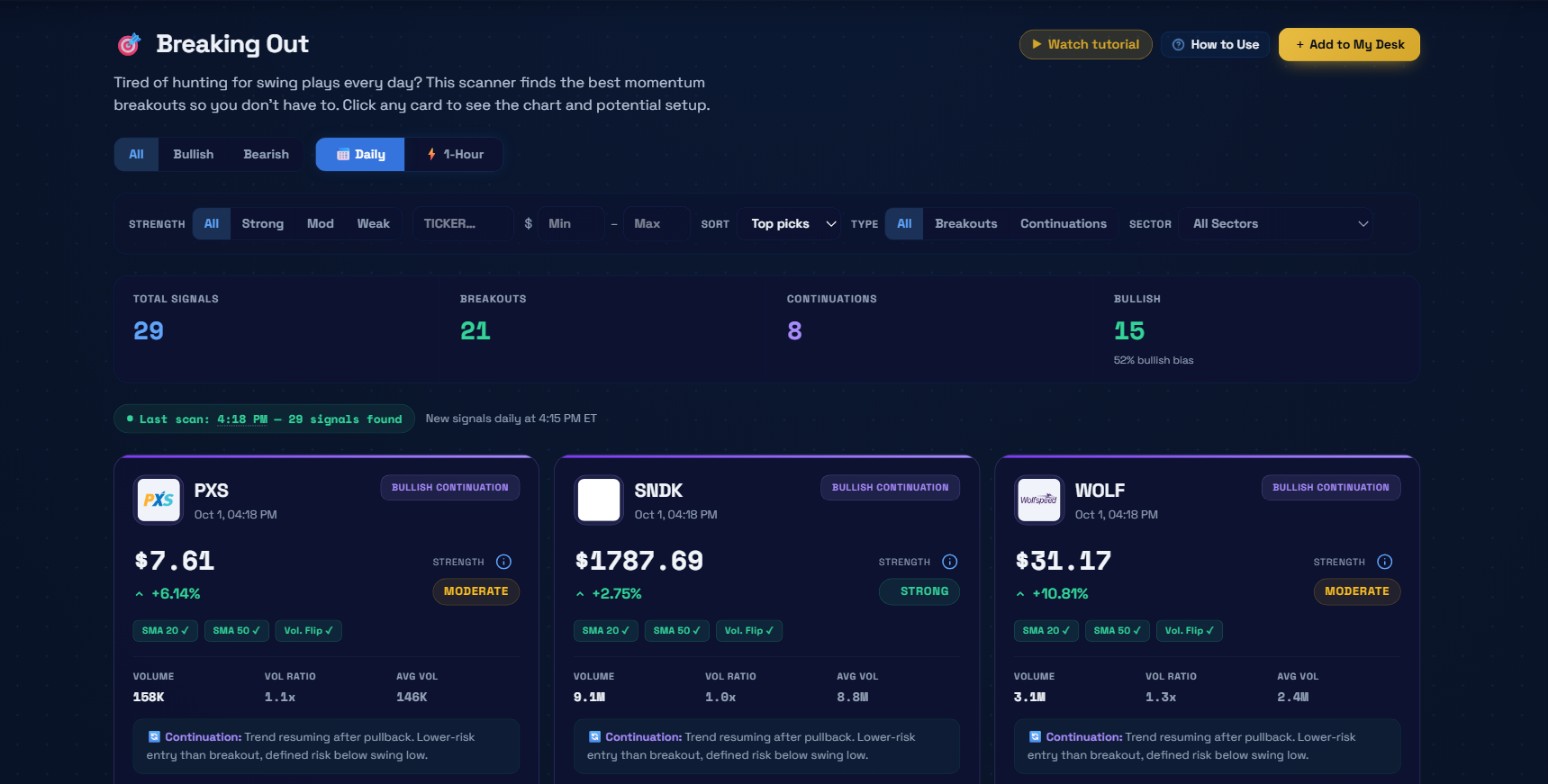 The full Breaking Out page after the close on October 1, 2026. 29 total signals found, 21 breakouts and 8 continuations, 15 bullish.
The header
The page opens with "Breaking Out" as the title and a short blurb: "Tired of hunting for swing plays every day? This scanner finds the best momentum breakouts so you don't have to. Click any card to see the chart and potential setup." Three buttons sit in the top right: Watch tutorial, How to Use, and Add to My Desk.
On October 1 the scan found 29 signals.
Tabs and the daily vs hourly toggle
Below the header you get three tabs: All, Bullish, Bearish. These filter the visible cards. All shows everything from both directions. Bullish shows only the green-labeled signals. Bearish shows the red ones.
Directly to the right of those tabs is a toggle between Daily and 1-Hour. This is an important distinction.
The daily scan runs after every market close. It looks at daily candles, which means the signal reflects what happened over a full trading day. Daily signals tend to be cleaner and more reliable for swing trades with a hold of several days to weeks.
The 1-Hour scan runs at 15 minutes past each market hour throughout the session. The 15-minute offset is deliberate: it accounts for data delay so the scan always processes a complete, closed hourly candle rather than a live estimate. Hourly signals are useful if you want to catch intraday momentum moves, but they expire faster and need more immediate confirmation.
For most swing traders, the daily tab is where to spend time. If you're active during the session, the hourly signals give you a continuous feed throughout the day.
Try this: Start every session review on the Daily tab with STRENGTH set to Strong. Only switch to the hourly feed if you are active during the session and want intraday setups.
The filter row
Under the tabs is a filter bar with several controls.
STRENGTH lets you filter to All, Strong, Mod, or Weak. This is the filter I use most. More on how strength is computed below.
The TICKER box lets you search for a specific name if you're checking whether something you're already watching showed up in the scan.
The dollar min and max price fields let you set a price range. Useful if you trade primarily small-caps, or want to exclude names outside your account size.
SORT defaults to Top picks.
TYPE lets you filter to All, Breakouts only, or Continuations only. I'll explain the difference in detail below.
SECTOR lets you filter to a specific sector from the dropdown. If you already have a sector thesis from Sector Flow, you can narrow the breakout list to match that theme.
The stat tiles
Below the filter row are four summary tiles.
On October 1 they read:
| Tile | Value |
|---|---|
| Total Signals | 29 |
| Breakouts | 21 |
| Continuations | 8 |
| Bullish | 15 (52% bullish bias) |
The 52% bullish bias means 15 of the 29 signals that day were bullish-direction. The scanner runs on the full universe without biasing toward either direction.
The five signal types
The scanner produces five distinct labels. Understanding each one before acting is worth the time.
| Signal type | What it means |
|---|---|
| BULLISH BREAKOUT | Oscillator flipped to bullish and price closed above the 20-bar resistance high. Confirmed break. |
| APPROACHING BREAKOUT | Oscillator triggered but price has not yet cleared the 20-bar resistance. Watchlist candidate, not an entry. |
| BEARISH BREAKDOWN | Oscillator flipped bearish and price closed below the 20-bar support low. Confirmed break to the downside. |
| APPROACHING BREAKDOWN | Bearish oscillator signal fired but support not yet broken. Watch only. |
| BULLISH CONTINUATION | Oscillator already bullish (trend established) and the TraderDaddy Volume indicator just flipped bullish after a pullback. Lower-risk entry than the initial breakout because a defined swing low acts as a stop. |
| BEARISH CONTINUATION | Same mechanics from the short side: oscillator already bearish, volume just flipped bearish. |
How signal strength is actually computed
The strength badge on every card shows STRONG, MODERATE, or WEAK. A lot of people assume this is based on how big the price move was or the volume ratio. It's neither.
Strength comes directly from the TraderDaddy Oscillator value. The oscillator produces a numeric output, and strength is classified from the absolute value of that number. If the absolute oscillator value is greater than 0.6, the signal is STRONG. Above 0.4 but not above 0.6 is MODERATE. Below 0.4 is WEAK.
The oscillator itself is built from seven underlying sub-signals:
- CAE (cyclical adjusted entry)
- MS (market structure)
- SMA filter
- TRAMA (trend-adaptive moving average)
- OBV
- OBV oscillator
- VWAP
When the composite of those seven components sits far from neutral, the absolute value is high and the signal comes in as STRONG. When it just barely crossed the threshold, it comes in as WEAK.
What this means in practice: a STRONG signal has a lot of sub-indicator agreement. The seven components are pointing clearly in the same direction with significant separation from neutral. A WEAK signal fired because the oscillator crossed the threshold, but the reading is close to the boundary. Less conviction in the underlying composite.
This is why the strength badge matters more than the day's price change. ROK on October 1 was up only 1.61%, but came in STRONG because the oscillator reading was well above 0.6 and the 20-bar resistance was clearly cleared. A stock can have a dramatic move and still show WEAK if the oscillator barely crossed the line.
Key point: STRONG means the seven oscillator sub-components are clearly aligned with significant separation from neutral. WEAK means the oscillator barely crossed the threshold, regardless of how big the day's price move was.
Reading a breakout card in detail
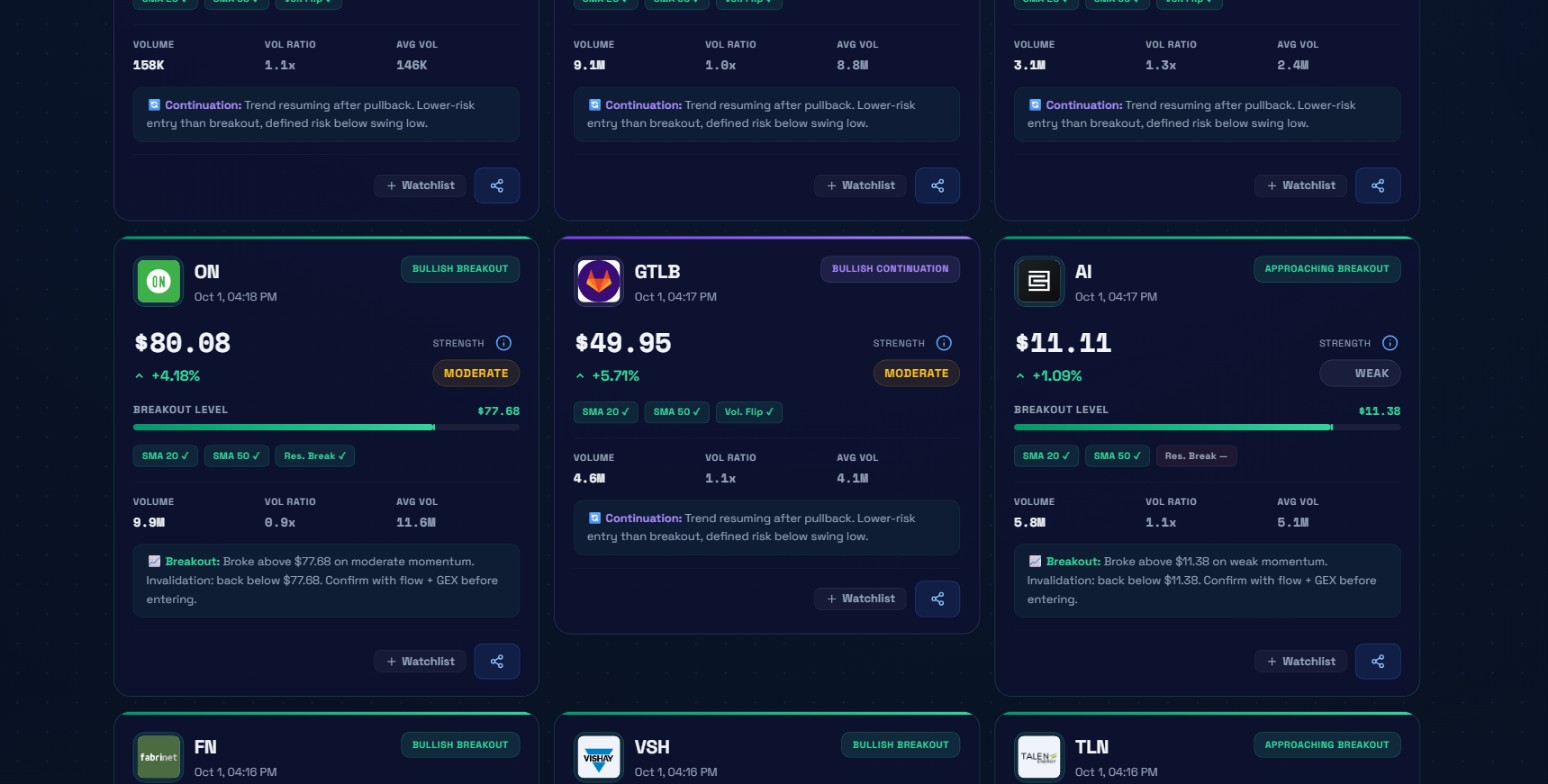 Cards from October 1 showing the range of signal types and strengths. ON shows the breakout level bar clearly. AI is marked APPROACHING because price at $11.11 hasn't cleared the $11.38 resistance yet.
Let me walk through a real card. ON showed up on October 1 as BULLISH BREAKOUT, MODERATE strength, price $80.08, change +4.18%.
The card shows a green bar labeled BREAKOUT LEVEL with $77.68 marked on it. The current price of $80.08 is above that level, so this shows as a confirmed break rather than approaching. The level itself is the 20-bar resistance high before the signal candle: the highest price reached in the 20 daily bars immediately before today.
Below the price row are three chips: SMA 20, SMA 50, and Res. Break. Checkmarks on SMA 20 and SMA 50 mean the current price is above both the 20-day and 50-day simple moving averages. A checkmark on Res. Break means the price closed above the breakout level. When a chip shows a dash instead of a checkmark, that condition wasn't met.
Then the volume row: VOLUME 9.9M, VOL RATIO 0.9x, AVG VOL 11.6M. Volume at 0.9x the 20-day average on this breakout day. That's one reason ON came in MODERATE rather than STRONG: the oscillator had enough composite signal to fire, but volume didn't add much weight.
At the bottom of the card: "Breakout: Broke above $77.68 on moderate momentum. Invalidation: back below $77.68. Confirm with flow + GEX before entering."
That invalidation level is one of the most useful things on the card. If you enter this trade and price comes back below $77.68 and closes there, the thesis is wrong. That's where you cut the position.
Watch out: The breakout level is the invalidation line, not a profit target. A close back below it means the setup is off. Target zones come from Apex levels when available, GEX walls, and prior swing highs.
Now look at AI (the ticker). Also October 1: APPROACHING BREAKOUT, WEAK, $11.11, +1.09%. Breakout level $11.38. The Res. Break chip shows a dash. Price at $11.11 hasn't cleared $11.38 yet. The note: "Broke above $11.38 on weak momentum. Invalidation: back below $11.38. Confirm with flow + GEX before entering." Watch, don't trade.
Continuation cards
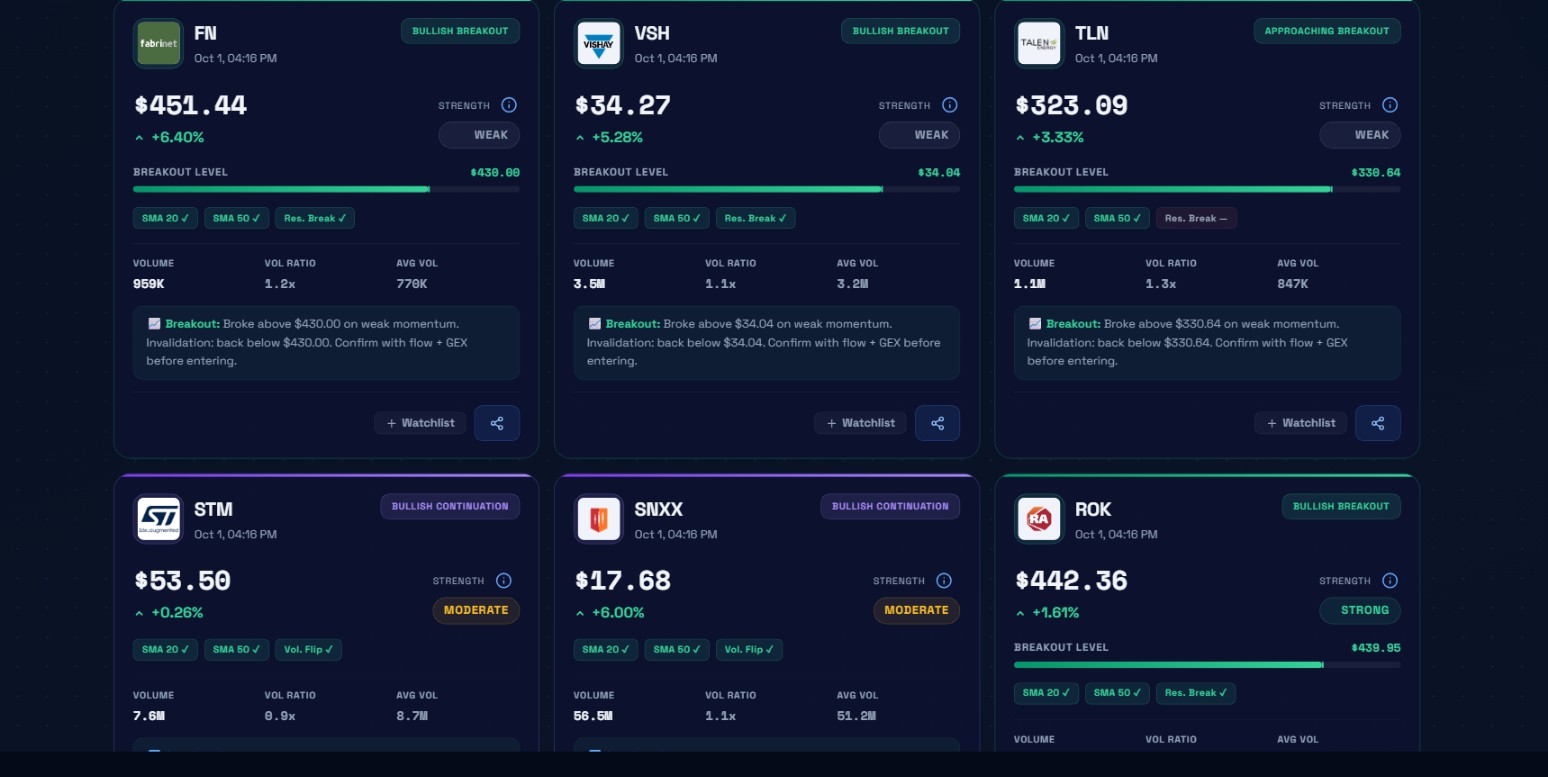 ROK's STRONG BULLISH BREAKOUT with all conditions confirmed. STM and SNXX show continuation cards with the Vol. Flip chip instead of Res. Break.
ROK on October 1 was the strongest signal of the session: BULLISH BREAKOUT, STRONG, $442.36, +1.61%, breakout level $439.95. SMA 20 checked, SMA 50 checked, Res. Break checked. The note: "Broke above $439.95 on strong momentum. Invalidation: back below $439.95. Confirm with flow + GEX before entering."
Small price change, every condition confirmed, oscillator reading above 0.6. That combination is what to look for.
Now compare STM and SNXX, both BULLISH CONTINUATION MODERATE. Their chips are different. Instead of Res. Break, you see Vol. Flip with a checkmark. That's the volume-turned-bullish flag from the TraderDaddy Volume indicator. The continuation note reads: "Trend resuming after pullback. Lower-risk entry than breakout, defined risk below swing low."
Continuation cards don't show a breakout level bar because they're not breaking through resistance. The oscillator is already bullish. The continuation fires because the volume component realigned with the existing trend after a temporary dip.
One practical thing to know about the dedup system: if a BULLISH BREAKOUT already fired for a ticker on the daily scan, any BULLISH CONTINUATION for the same ticker that same day is automatically suppressed. The breakout card is already in the feed. The reverse doesn't apply: a continuation that fires first doesn't block a breakout if price then clears a higher level.
Key point: BULLISH CONTINUATION fires when the oscillator is already bullish and volume just realigned with the trend after a pullback. Lower-risk than chasing the initial breakout because the swing low gives you a defined stop.
Bearish signals
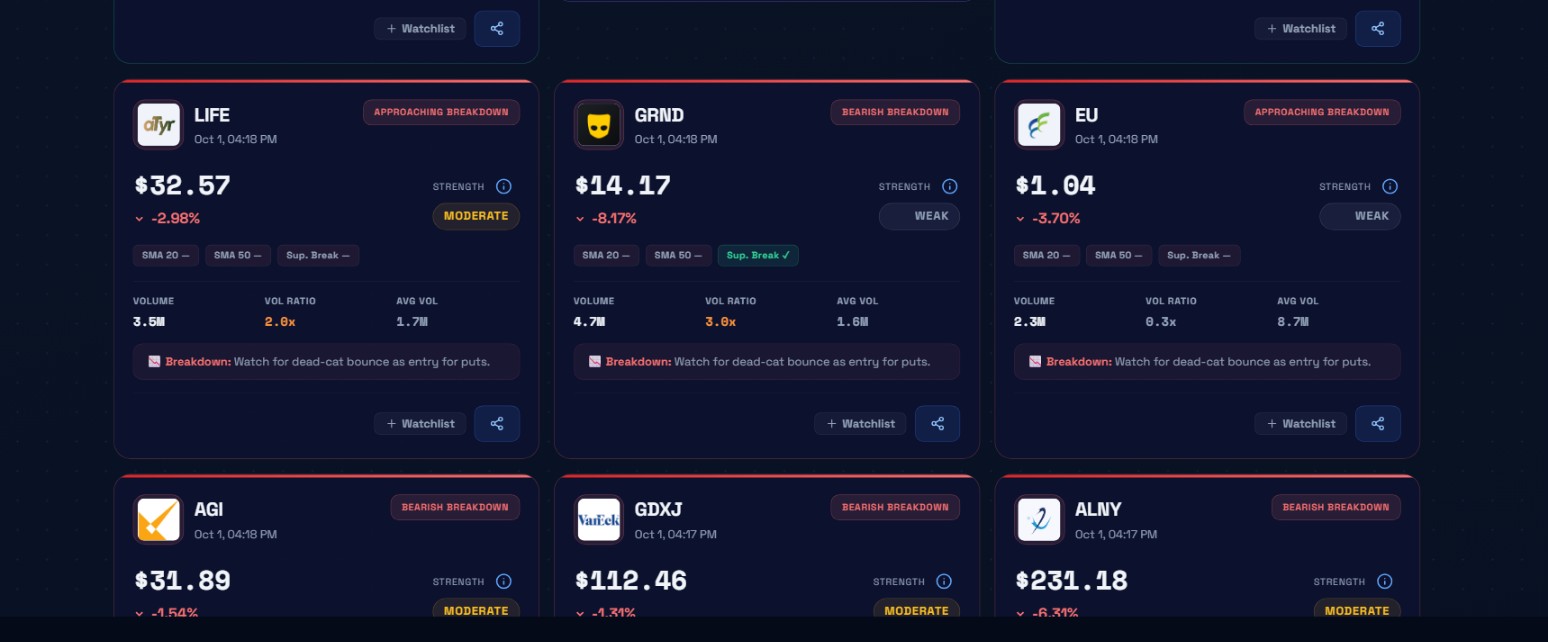 Bearish cards from October 1. GRND has the Sup. Break chip confirmed. LIFE is approaching with the chip dashed.
The bearish side works symmetrically. GRND on October 1: BEARISH BREAKDOWN, WEAK, $14.17, -8.17%. Sup. Break chip with a checkmark. The support break chip is the bearish equivalent of resistance break: price closed below the 20-bar support low.
LIFE at $32.57, -2.98% showed APPROACHING BREAKDOWN MODERATE, Sup. Break chip dashed. Support level not yet taken out. EU at $1.04, -3.70% showed APPROACHING BREAKDOWN WEAK.
The distinction between BEARISH BREAKDOWN (confirmed) and APPROACHING BREAKDOWN (unconfirmed) mirrors the bullish side exactly. Don't short a name on a breakdown chip without checking whether the support level was actually cleared.
Personally, I rarely trade bearish cards in a broad market uptrend. A single-stock breakdown while its sector is showing positive flow in Sector Flow is fighting two signals at once. In a confirmed downtrend environment, these signals get more interesting. In a bull market, I mostly ignore the bearish tab.
Watch out: A BEARISH BREAKDOWN in a sector showing positive flow in Sector Flow is fighting two signals at once. Check sector direction before acting on any bearish card.
The chart modal
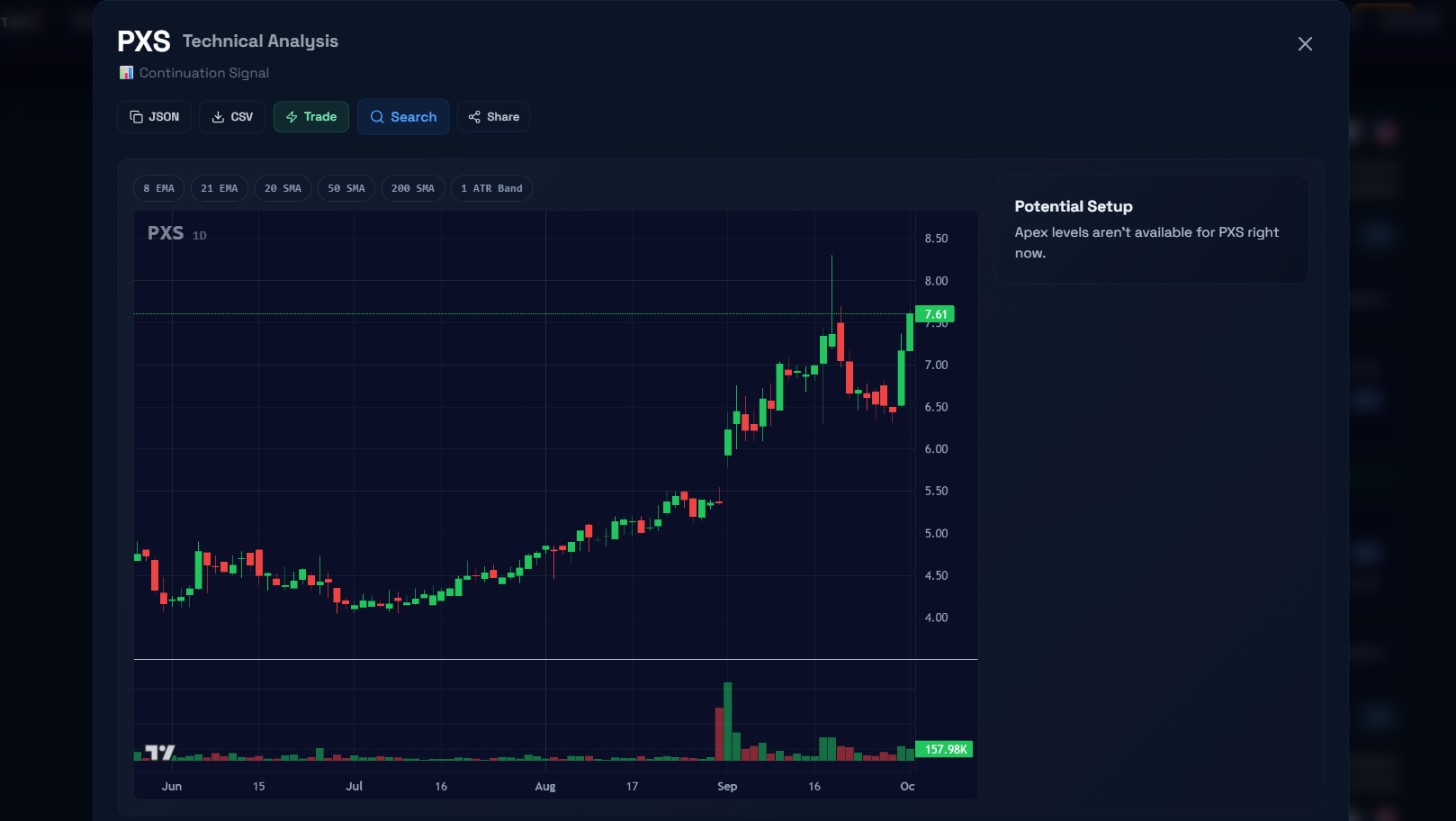 Click any card and this modal opens. PXS shows a clean uptrend from around $4.39 in June to $7.61 in October. The overlay toggles are visible across the top of the chart area. Apex levels weren't available for PXS on October 1.
Clicking any card opens a Technical Analysis modal. At the top you see the ticker and signal type: PXS shows "Continuation Signal" just below the name.
The chart is a daily candlestick view. Along the top are toggle buttons for the overlays: 8 EMA, 21 EMA, 20 SMA, 50 SMA, 200 SMA, and 1 ATR Band. You can turn each one on or off individually. These aren't just visual decoration: the 20 SMA and 50 SMA are what the signal computation uses to classify price alignment. If you see price well above both on the chart, that confirms what the SMA chips on the card are showing you.
The volume panel sits below the main chart. In the PXS chart from October 1 you can see volume picked up in late September going into October, visible in the taller volume bars on the right side of the panel.
Above the chart are export and action buttons: JSON, CSV, Trade, Search, and Share.
On the right side of the modal is the Potential Setup panel. When Apex levels are available for the stock, they appear here and give you price levels based on options dealer positioning from the GEX data. PXS on October 1 showed "Apex levels aren't available for PXS right now." For smaller names with thinner options markets, that message is common. For names where Apex levels do appear, they're worth looking at before deciding on a target zone.
Building a routine around this scanner
The most common way people misuse this page is opening it, seeing all 29 cards, and picking the one with the biggest percent move or the most familiar name. Neither of those is a process.
Here's what actually works.
After the close, go to the Daily tab and set STRENGTH to Strong. On October 1 that would have narrowed the list significantly. ROK was the clearest strong breakout, and SNDK (BULLISH CONTINUATION STRONG, $1787.69, +2.75%) was another STRONG signal from that session.
With that short list, open each chart modal. Look at two things: where price sits relative to the 20 SMA and 50 SMA, and what the volume pattern looks like over the last 3 to 4 weeks. A stock that broke out cleanly but has been in a downtrend for two months deserves more skepticism than one that's been in a steady uptrend.
Then go to Unusual Activity and check each name. A BULLISH BREAKOUT with simultaneous call sweeps on the options tape is a different setup than a breakout with no unusual options activity. The options market and the equity market are independent data sources. When they agree, you have two separate inputs pointing the same direction.
For any name that passes both filters, run it through Sector Flow to see whether the sector has supporting flow. A semiconductor name breaking out with the sector in positive flow has more macro backing than a breakout against sector-wide outflows.
That full workflow takes 15 to 20 minutes after the close. Most names won't make it through all three filters. The ones that do go on a watchlist.
Try this: Run the three checks in sequence after the close: STRENGTH Strong on Breaking Out, then Unusual Activity for those same tickers, then Sector Flow. Names that pass all three filters go on the watchlist.
The next morning, before entering anything, look at how price opened relative to the breakout level. If the stock gapped up and is already 3% above the level, you're not entering at a good risk-reward. Wait for a pullback toward the breakout level. If the prior resistance holds as support on the retest, that's the entry. If it fails, the setup is off.
On the hourly scan specifically
The hourly scan is genuinely useful, but it needs more active management. The card fires at :15 past the hour after a complete hourly candle closes above resistance. That break already happened. Buying the moment the card appears means buying after the spike.
Wait 20 to 30 minutes after a card shows up. Watch whether the cleared level holds as support. If price pulls back, touches the level, and finds buyers there, that's the confirmation. If it immediately rolls back through the level, that was a false break and you saved yourself a bad trade.
Watch out: On the hourly scan, the card fires after the break already happened. Wait 20 to 30 minutes and watch whether the cleared level holds as support before committing to a position.
What each tool in this family does
The Breaking Out scanner sits in a different category from the flow tools. It's a technical scanner running on price and volume data, not options data. That makes it most useful as a starting point for candidates, which you then cross-reference with the options-based tools.
| Tool | What it shows |
|---|---|
| Unusual Activity | Scored feed of individual options prints ranked by volume-to-OI ratio, premium size, bid-ask spread, and DTE. One row per print. |
| Live Flow | Per-ticker rollup of the $20k-plus options tape: total premium, trade count, bull/bear split, biggest recent print. Shows where premium is concentrating and which direction it leans. |
| Heat Map | Visual urgency board of ticker tiles showing which names are seeing the most unusual options traffic relative to their baselines. |
| Sector Flow | Sector-level dashboard showing where institutional options flow is going across the major market sectors. |
| Dark Pool | Off-exchange block prints in equities: where large equity trades are clearing and which direction they lean relative to the prior session's close. |
| Earnings Flow | Pre-earnings options positioning for names with upcoming earnings. |
Green flags and situations where I wait
Green flags:
- All three conditions met: oscillator above 0.6 (STRONG badge), price above both SMAs, resistance break confirmed, volume at or above average.
- Options flow in the same direction from Unusual Activity on the same session or the prior session.
- Sector showing net inflows in Sector Flow while the individual name breaks out: a macro tailwind.
- No large gamma wall directly above the breakout level in GEX. A breakout that clears through a gamma wall often has more room than one stalling right into one.
Where I wait:
- APPROACHING BREAKOUT with resistance not yet cleared. Watch, not trade. Wait for a follow-up signal with the resistance confirmed.
- WEAK strength with no supporting flow. Not worth the capital.
- A BEARISH BREAKDOWN in a sector that is broadly green. Fighting too many signals at once.
Common mistakes
-
Buying the card the moment it appears. The breakout already happened on the prior candle. If a stock opened up 5% based on a signal the daily scan detected, buying at the open means buying the spike. Wait for the pullback.
-
Ignoring the STRENGTH badge. WEAK and STRONG cards look nearly identical until you check the badge. Set the STRENGTH filter to Strong as the starting point, then expand from there if you want to go deeper.
-
Treating the breakout level as a profit target. It is the invalidation level: the price where the thesis is wrong if price closes back below. Target zones come from Apex levels when available, GEX walls, and prior swing highs.
-
Using the scanner alone without cross-referencing options flow. A breakout with no supporting flow and a GEX wall right overhead is a much weaker setup than one where everything aligns.
An open question
I genuinely don't know whether filtering to STRONG and waiting for the retest every time is the right strategy for everyone. It's right for my style. If you're a faster trader, MODERATE signals with quick exits might work better for you than slower STRONG setups with more room. I haven't run a systematic comparison, so I'm not going to tell you which approach produces better results. What I can say is that filtering to STRONG cuts the list down fast and the setups tend to have cleaner invalidation levels.
Nothing on this page is financial advice or a recommendation to buy or sell any security. Options trading carries substantial risk and can result in the complete loss of capital invested. Past signals do not predict future results.