Loading...

Signal Scanners deep dive · 19 min read
How to Read Tape Confirmed
A plain-English walkthrough of Tape Confirmed: the three-tab convergence view that crosses chart setups against live options tape. Every column explained down to the formula, real rows from October 1, 2026, and how to build a routine around it.
Open the tool →Hey guys, Art from TraderMatrix here. Today I want to walk through Tape Confirmed, which lives at /screeners/aggregated. It's one of the more misunderstood pages on the platform. People either skip it because it seems like a duplicate of the individual scanner pages, or they use it as a shortcut without understanding what the numbers mean. Neither gets the most out of it.
The page is compact: two filter rows, one table that's eight to twelve rows on an active day. But what's happening under the hood is more sophisticated than it looks. This guide goes through the underlying logic, every column in the table, the real rows from October 1, 2026, and how to build an actual workflow around it.
The short version:
- Tape Confirmed crosses three scanners (Breaking Out, Gap Continuation, LEAPS) against the live options tape and shows only names where both fire, in the same direction. Breakouts and gaps run both ways (bullish and bearish); LEAPS is bullish only.
- The conviction score measures how directionally consistent the flow is from the open. The minimum threshold to show as bullish or bearish is 15%.
- RS vs SPY is a trailing 30-day lookback on daily closes, not today's return. A large negative RS figure means a month of underperformance before this session.
- Zero rows on any tab is normal. The intersection requires both a scanner signal and a tape signal to fire at the same time.
- After finding names here, go to Unusual Activity to see the individual prints that built the conviction reading.
The problem this page exists to solve
Think about what it looks like to manually find high-conviction setups. You open the Breaking Out scanner, which might have 30 to 50 names on an active day. You open Unusual Activity. You start scrolling through both feeds looking for names that appear in both. This works, but it takes time and it introduces a subjective layer, because you're making judgment calls about which coincidences count.
Tape Confirmed does that work automatically. It takes the live ticker set from each of three scanners and cross-checks it against the live options tape. Only names where both sources fire show up in the result. The page loads every setup in both directions in parallel when you open it, so switching between them is instant.
Before September 2026, the page had a free-form picker where you could combine any two or four scans from a library and see the overlap. That got retired after real-world overlap between most scan pairs came in near zero. The combinations that survived were exactly the three you see now: Breakout, Gap Continuation, and LEAPS. Measured fact from the data, not a design preference.
What a breakout setup is
A breakout is price clearing a prior resistance level with volume behind it. The resistance might be a recent swing high, a multi-week consolidation ceiling, or a prior high that's been tested several times and held. The pattern says that sellers who've been defending that level have been absorbed or have stepped aside, and buyers are now willing to transact at these higher prices.
Volume separates a real break from a fake one. Price pushing into resistance on light activity looks identical to a breakout until it stalls and reverses. Expanding volume on the break means real transactions are happening at the new price level. A quiet break, same activity as every other day, has a substantially higher failure rate.
The Breaking Out scanner at /breaking-out identifies these setups. It catches both fresh breakouts and continuations (a stock already trending that clears its next level shows up too). The scanner output is the ticker set that feeds the Breakout tab on this page.
What a gap continuation is
A gap is when a stock opens meaningfully higher than where it closed the prior session, with a range where no trading happened overnight. The opening gap itself is common. What matters is whether it holds.
The Gap Continuation Scanner at /gap-continuation-scanner focuses on large-cap names (above $2 billion) that gap up 2% or more at the open. It checks whether the gap held through the opening range. A stock that consolidates early selling pressure and then breaks above the high of its first 15-minute bar is showing that the initial gap wasn't just a pre-market spike. Buyers stepped in as early sellers took profits.
What makes the Gap Continuation + Tape Confirmed tab worth reading hours after the open is in the caption the page shows directly: "Confirmed gap continuations where the LIVE options tape still agrees right now, a fresh re-check, not just this morning's call." The gap scanner ran in the morning. Tape Confirmed is asking whether the options market is still positioned bullishly on those names hours later. When the answer is yes, the setup has sustained positional conviction across multiple hours of trading, not just the moment the gap first confirmed.
What LEAPS candidates are
LEAPS are options contracts with expiration dates longer than a year out. A LEAPS call is a way to take a directional view with more time for the thesis to play out. You're buying time to be right rather than trying to nail a specific entry window.
The LEAPS Screener at /screeners/leaps identifies names that work as long-dated candidates: liquid enough to have a real chain far out, and at a price and volatility level where a long-dated call has reasonable risk-to-reward. It's not a momentum tool. The names it surfaces tend to be large, liquid, and stable enough that holding for 12 to 18 months isn't structurally unreasonable.
The LEAPS pairing exists here for a measured reason. The directional flow tracking system covers a curated set of liquid names, because liquid names have enough options volume to read properly. The LEAPS screener universe, by construction, requires liquid optionable names. When the overlap was measured in September 2026, roughly 47% of LEAPS results appeared in the flow universe. Compare that to single-digit percentages for small-cap or momentum screeners, and you can see why those didn't get their own Tape Confirmed pairing.
What "tape agreement" actually means
All three tabs use the same underlying signal for the tape side, and it's worth going through precisely because this is where people make the most assumptions.
The platform samples the options tape throughout the session and builds a cumulative delta from the open for each tracked underlying. Every contract that trades carries a delta. A call trade adds positive delta, a put trade adds negative delta. The system sums these from the open, producing a from-the-open net read of whether options contracts are being bought more on the bullish or bearish side for each name.
A positive cumulative delta means call-side positioning is winning. A negative cumulative delta means put-side is winning. But raw sign alone doesn't qualify a ticker as "bullish." The system also computes a conviction score.
Conviction measures how directionally consistent the flow is as a fraction of the maximum it could theoretically be. The formula: the absolute value of the cumulative delta, divided by (contract volume times 100 times 0.5), capped at 1.0. If every single contract that traded were fully one-sided, the denominator is what the numerator would be. The conviction score is how close the actual net is to that theoretical maximum.
The minimum threshold to be called "bullish" or "bearish" rather than "balanced" is 15%. Below that, even a positive cumulative delta gets treated as too noisy to call directional. SPY on most days has massive call and put volume that nearly cancel each other out. The near-zero net lean correctly reads as "balanced" rather than declaring a direction off noise.
The "Bullish" label next to every ticker on these tabs means: cumulative delta is positive AND conviction cleared 15%. Both conditions together.
Key point: A positive cumulative delta alone does not qualify a name as bullish. Both the direction and the 15% conviction threshold have to clear. SPY reads as "balanced" on most days because massive call and put volume nearly cancels out.
The page itself
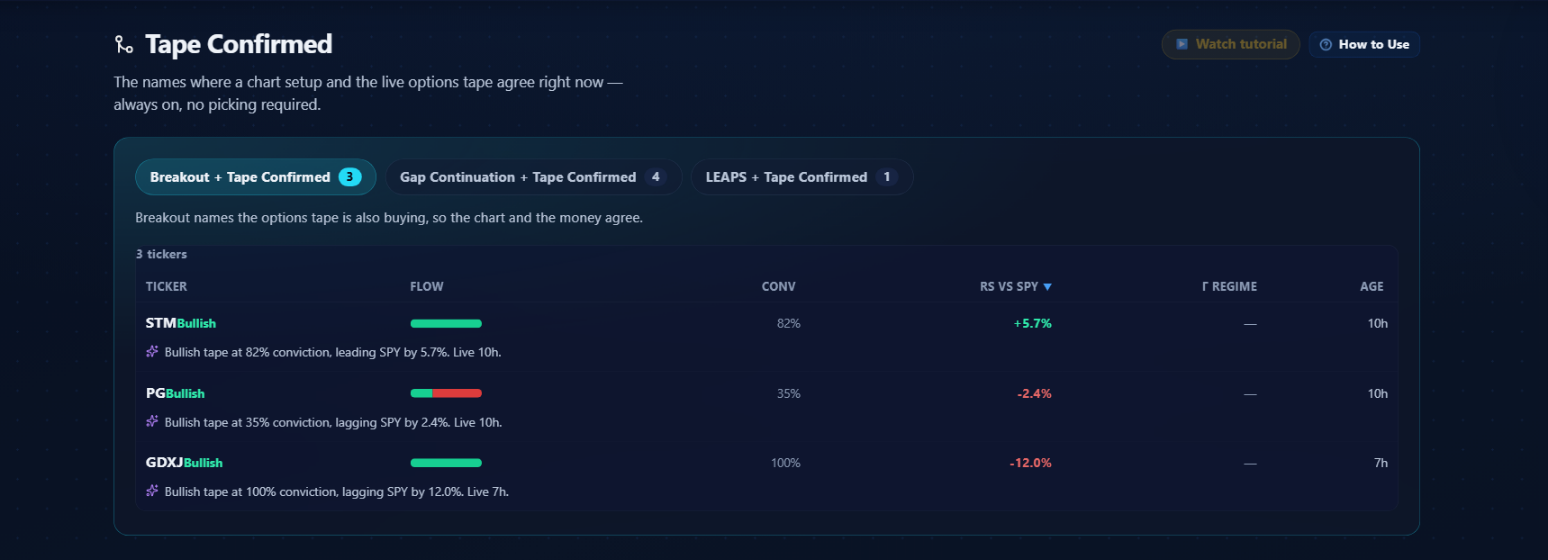 October 1, 2026 session, after the close. Breakout tab is active, 3 confirmed names. Tab badges show live counts for all three simultaneously.
The header reads "Tape Confirmed" with the subtitle: "The names where a chart setup and the live options tape agree right now, always on, no picking required." Watch tutorial and How to Use sit in the top-right corner.
Below that is a single panel with three tabs. All three load on page open, in parallel. On October 1, the badges showed 3 on Breakout, 4 on Gap Continuation, 1 on LEAPS.
A count of zero is a regular outcome here, not a glitch. The intersection is strict: both the scanner and the tape have to fire, and the tape threshold is 15% conviction. On a slow tape day, zero rows means zero names cleared both gates. On some days the market just isn't confirming setups with options positioning, and the page will tell you that.
Watch out: Zero rows on any tab is valid information, not a bug. On a slow tape day, "nothing confirmed today" means the setups are not backed by options positioning right now.
Layout update, October 11, 2026: the three tabs became a Setup filter (Breakout, Gap Continuation, LEAPS, each with its live count) next to a Direction filter (All, Bullish, Bearish), plus a ticker search box and a CSV export. The screenshots in this guide show the older tabbed layout; the numbers and columns they illustrate read the same way.
Reading the table column by column
TICKER and the direction pill
Click a row (or the ticker) and the chart opens right on the page. You no longer get sent to Ticker Search.
Next to the ticker is a Bull or Bear pill. Breakout and Gap Continuation run both ways: a breakout with bullish tape, or a breakdown with bearish tape; a gap-up continuation with bullish tape, or a gap-down continuation with bearish tape. The chart's direction and the tape's direction always match. LEAPS is bullish only, because a LEAPS here is a long call held in place of shares.
SETUP
What the chart side actually fired. On Breakout it's the signal type (Breakout or Continuation) with its relative volume, like "2.4× vol". On Gap Continuation it's the setup's A-D grade with the gap size, like "Grade A, gap +4.2%". LEAPS has no per-row setup.
PRICE and DAY %
Last price and today's change, so you can see whether the move is still running without opening the chart.
FLOW bar
The Flow column is a horizontal split bar, green on the left and red on the right. Green represents the count of bullish prints for this ticker today. Red represents bearish prints. The split is the bullish print count divided by total prints.
This is a raw count, not dollar-weighted. A ticker with many small bullish trades and a couple of large bearish ones might show a mostly green bar while the dollar-weighted net is less lopsided. The conviction column captures the dollar weighting. The flow bar shows the raw directional lean of individual trades.
On October 1: STM had a nearly solid green bar. PG showed a green majority but with visible red. GDXJ had a nearly solid green bar consistent with its 100% conviction reading.
CONV
Conviction displays as 0 to 100%, the direct rendering of the underlying 0-to-1 score multiplied by 100 and rounded.
STM at 82% had strong directional agreement from the open. PG at 35% was net positive but with real two-way traffic. GDXJ at 100% had essentially no net bearish delta. SMCI on the LEAPS tab came in at 24%, just above the 15% floor. FICO on the Gap Continuation tab at 27%.
Any row here passed 15%; that's the entry bar. Both 24% and 82% are confirmed; they're different intensity levels. When the list is long enough to choose from, I weight higher-conviction names more. Below 30%, the setup is confirmed but the flow signal isn't loud.
One thing to watch: 100% conviction on a name with two trades is not the same quality as 100% on heavy volume. The formula caps at 1.0, so two bullish prints on a quiet ticker hits 100% the same as 200 consistent prints across the session. Check Unusual Activity when conviction is maxed out to see how many prints actually built that reading.
RS vs SPY
This is the most commonly misread number on the page. It shows a signed percentage, green when positive, red when negative. On October 1, FICO showed -39.7% and GDXJ showed -12.0%, and both were still on the scan.
Here's what it actually measures: the ticker's price return over the past 30 calendar days (roughly 20 trading days) minus SPY's return over the same window. Both come from daily closing prices. The result is relative outperformance or underperformance versus the market index over that one-month period.
This is not a today number. Not a session return. A stock that was down 35% over the past month but had a large gap day today still shows a large negative RS figure until that history rolls off.
Watch out: RS vs SPY is a trailing 30-day lookback on daily bars. FICO at -39.7% means it trailed SPY by 39.7 percentage points over the past month before this session, not that it dropped 39.7% today.
The table defaults to RS sorted highest-to-lowest, which is why SNPS at +18.1% and TSEM at +16.8% sit at the top of the Gap Continuation tab and FICO at -39.7% sits at the bottom. The sort is cosmetic; it doesn't affect what makes the list.
Why does a name with -39.7% RS appear on a bullish confirmation scan? Because RS and the confirmation criteria are independent. FICO's gap scanner fired this morning. The tape showed bullish conviction hours later. Both gates cleared. The RS of -39.7% tells you this stock was in a sustained drawdown relative to the market before this session. That's a completely different kind of setup from TSEM, which has been leading the market for a month. Two different charts, two different reasons to be there.
GDXJ at -12.0% RS is a gold miners ETF. Miners decorrelate from equity indices regularly, so negative relative strength to SPY during a period when equities were running doesn't mean GDXJ is broken. It means it's tracking a different commodity.
FIRED
How long ago the chart setup triggered: when the breakout signal fired, or when the gap continuation confirmed. It replaced the old Age column, which measured when the name first showed up in the tape and read "2d" for every row over a weekend.
The gamma regime column and the plain-English line under each row were removed on October 11, 2026. Gamma read stored GEX, which only covers a curated set of liquid names, so it showed a dash on nearly every row; the summary line repeated the columns next to it.
Walking through October 1, 2026
Breakout tab: 3 names
The three breakout names on October 1 show a useful spread.
STM at 82% conviction, +5.7% RS, 10h. Nearly solid green flow bar. Breaking Out scanner fired, tape is strongly directional, stock has been outpacing the market for a month. All the readings point the same way.
PG at 35% conviction, -2.4% RS, 10h. Flow bar shows clear green majority but real red. PG is a consumer staples stock with low beta, and -2.4% relative strength over a month is roughly in-line for that sector. The conviction clears the bar but isn't loud. What I'd look at here is the chart: consumer staples don't usually produce aggressive technical moves, so whatever structure the scanner found is worth seeing.
GDXJ at 100% conviction, -12.0% RS, 7h. Gold miners ETF. Every net print pointed the same direction. The -12.0% RS reflects sector decorrelation from equities, not a broken setup. A 7h age means this conviction built across most of the trading session rather than arriving late. Miners can have clean technical setups that have nothing to do with what equity indices are doing.
Gap Continuation tab: 4 names
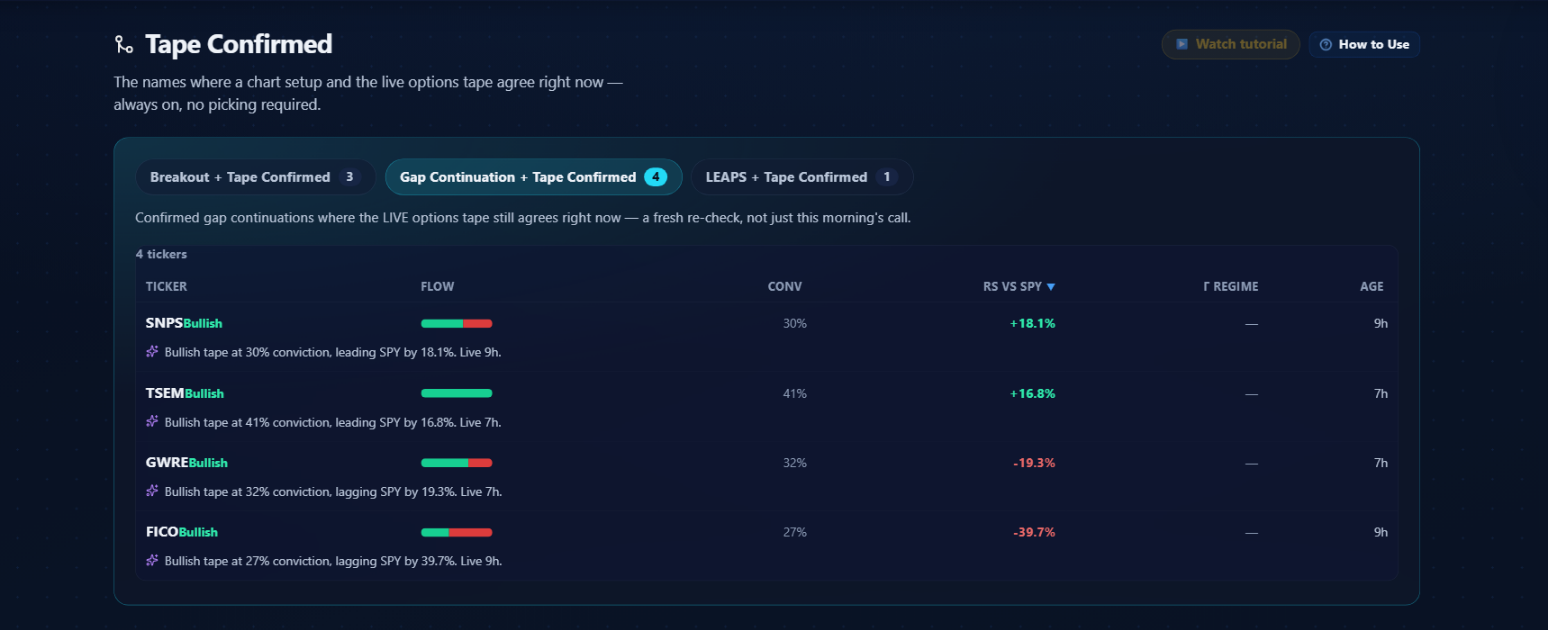 Four confirmed gap continuations from October 1, 2026, still backed by bullish tape hours after the morning open. FICO at -39.7% RS is a potential reversal setup, not a momentum continuation.
This tab is the most instructive on October 1 because the RS values span nearly 60 points.
SNPS and TSEM sit at the top with +18.1% and +16.8% RS. Both have been outperforming the market for a month, both confirmed their gaps through the opening range, and both maintained bullish tape conviction for 7 to 9 hours.
GWRE at 32% conviction, -19.3% RS. The flow bar shows a real green-to-red split. 32% means a net lean but with meaningful two-way traffic. -19.3% RS tells you GWRE has underperformed the market for a month before this gap. The tape has held its bullish lean for 7 hours since the opening confirmation. Whether that makes it a genuine reversal or a failed bounce is a chart call.
FICO at 27% conviction, -39.7% RS. A nearly 40-point trailing underperformance is a name that's been through a rough stretch. The conviction barely clears 15%, and the flow bar shows a real split. If FICO interests you, the chart is the first thing to look at: what the gap looked like, whether the opening range break was clean, whether there's a real base forming or just a brief countertrend move.
LEAPS tab: 1 name
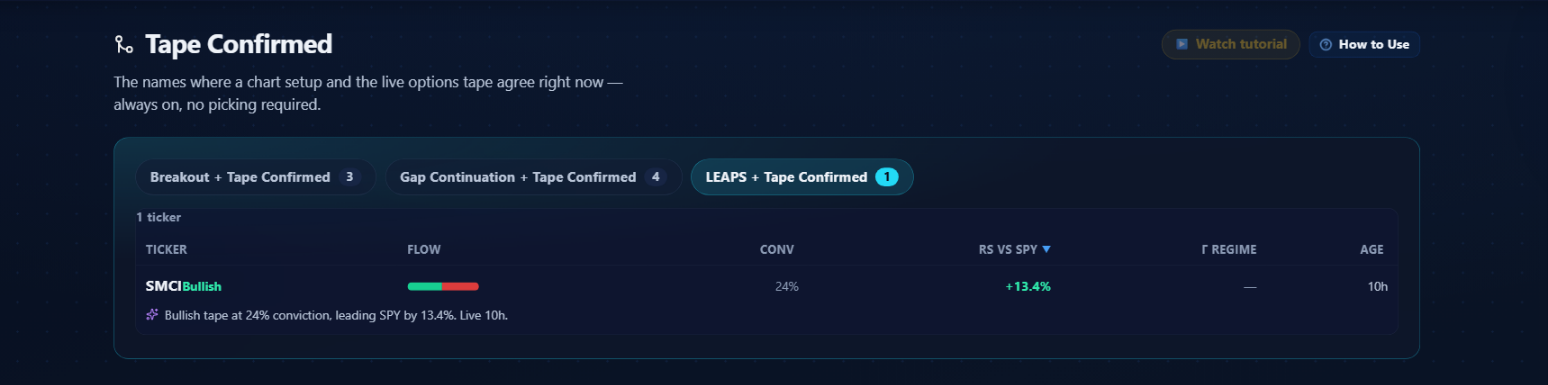 One LEAPS candidate with tape agreement on October 1, 2026. SMCI had been in the session's flow data since near the open.
SMCI at 24% conviction, +13.4% RS, 10h. Conviction is modest, just above the 15% floor. For a LEAPS candidate that's not alarming: the thesis is multi-month, not intraday. The stock has outperformed SPY by 13.4% over the past month, and the tape maintained a net-bullish lean for essentially the entire session. For a long-dated position, sustained conviction over hours matters more than a peak reading within a single hour.
From here I'd open the LEAPS screener at /screeners/leaps to understand what specifically qualified SMCI, check the chain at 12 to 18 months out, and build a thesis from there.
Building a routine
Thirty to forty-five minutes after the open is a useful first check. The gap continuation scanner has had time to run its first look, and the cumulative directional flow has started building a real reading. Very early-morning data reflects a short window; the read is more reliable with more session behind it.
Midday is when the Fired column starts to mean something. A setup that fired hours ago and still carries tape conviction has held up through multiple sampling windows without reversing. A fresh trigger caught the move early but has less history. Both are worth different amounts of attention.
Try this: At midday, look at the Fired column before the conviction column. A setup that fired this morning and still shows 35% conviction has more persistence than one that fired 30 minutes ago at 80%. Together they tell a better story than either alone.
End of day is useful for planning. Names confirmed by both sources near the close are worth carrying on a watch list into the next session. A breakout that held conviction through the full day might carry overnight. A gap continuation still backed by bullish flow late in the session earned that description across a full trading day.
After finding names I want to follow, the next stop is Unusual Activity at /unusual-activity. That shows the individual prints that built the conviction reading: which strikes, which expiries, whether the trades were sweeps or blocks, whether they hit at the ask. A 90% conviction score built from one massive sweep is a different read than the same score built from 20 consistent buys across the session. Unusual Activity is where you tell the difference.
For LEAPS names, I also look at the full screener output at /screeners/leaps to understand why the screener qualified this name. The LEAPS screener runs on fundamentals and chain characteristics that the Tape Confirmed table doesn't surface.
Live Flow at /live-flow shows the full session picture per ticker: total premium, dollar-weighted bull/bear split, and the biggest print. If the bullish conviction on Tape Confirmed represents a small fraction of a heavily balanced book, that's a different situation than a name where the bullish flow is the dominant story.
Sector Flow at /sectors is a useful final check. A name with breakout structure and bullish tape conviction in a sector showing net inflow is a more durable read than one going against sector rotation.
Limits and what to watch for
A few things this page cannot do for you:
- The chart call is still yours. The page narrowed the field, but it cannot tell you whether a breakout comes from a clean multi-week base or a spike into resistance. That requires the actual chart.
- RS is trailing 30 days, not today. FICO at -39.7% means it trailed SPY by 39.7 percentage points over the past month before this session, not that it dropped 39.7% today.
- Zero rows is valid. The intersection is strict. On slow tape days, "nothing confirmed today" is useful information, not a glitch.
- Bearish coverage is Breakout and Gap only. Breakdowns and gap-down continuations with bearish tape show under the Bearish filter. LEAPS has no bearish side.
- Options flow has multiple sources. It can come from hedging programs, systematic rebalancing, or directional positioning. Direction and magnitude are shown; what drove it is a separate question.
Where this fits with the other tools
- Breaking Out: The full source for the Breakout tab. Shows every name that cleared resistance on volume, including pattern type and signal freshness. Use it when you want the complete scanner view before the tape filter is applied.
- Gap Continuation Scanner: The source for the Gap Continuation tab, with full detail on each confirmed gap and the structural conditions that qualified it.
- LEAPS Scanner: The source for the LEAPS tab. Carries the screener metrics that qualified each name as a long-dated candidate, which the Tape Confirmed table doesn't surface.
- Unusual Activity: The next stop after any Tape Confirmed name. Individual prints show the specific contracts that built the conviction reading: strikes, expiries, sizes, and quality scores.
- Live Flow: Rolls up the full session flow per ticker. Total premium, dollar-weighted bull/bear split, and the biggest print. After Tape Confirmed identifies the names, Live Flow shows the full flow picture rather than just the directional conviction number.
- Sector Flow: Validates whether a Tape Confirmed name is moving with or against its sector.
Not financial advice. Trading involves real risk of loss, including amounts beyond your initial position. Nothing on this page is a recommendation to buy or sell any security.