
Underwater After This Week? A Put Will Not Get You Back to Even

If tech put you underwater this week, don't buy a put Monday.
The puts that paid this week were bought before the drop, when they were cheap. Or so I heard. Let us first focus on what matters most - what you paid for the shares you're trying to fix.
This post is the math for that, and the tool I built so you can run it in thirty seconds instead of thirty minutes.
TLDR: Underwater, a put caps the loss and raises the price you need to get back to even. Sell calls at or above your basis, price a 1x2 repair, or sell the shares and wheel. The Position Doctor runs all of it off the live chain against what you actually paid.
Got your broker wired to an AI? Paste this
If you’ve checked out awesome-broker-mcp and have your broker’s MCP connected to Claude, ChatGPT, or another agent through MCP, this prompt runs the same diagnosis on your real position. Swap in your ticker and paste it.
Diagnose my TICKER position. Read only: do not place or stage any order.

1. From my broker: shares held, average cost (say which field you used), current price. Under 100 shares, stop.
2. From the live chain, using mid prices and the broker's own deltas, price per 100 shares:
   - protective put near -0.30 delta, ~60 days
   - covered call near 0.30 delta, ~35 days
   - covered call at the first strike at or above my cost, ~35 days
   - collar (that put plus that call), same expiration
   - 1x2 repair: buy 1 call at the money, sell 2 at the highest strike where the credit still covers it, 60 to 75 days
3. For each: net cost, floor, cap, net delta, and the RECOVERY PRICE, the stock price at expiration where the whole position is back to $0. Show the math. If the cap sits below it, write NEVER.
4. Flag any cap below my cost, any earnings date inside an expiration, and any wide bid/ask.
5. Add one more: sell the shares and sell a cash-secured put, with the wash-sale warning.
Give me the numbers and the trade-offs. No recommendation.
If it hands you a recovery price without the arithmetic, make it show the arithmetic.
What this week did to you
If you own tech, you had a bad week with me - it wasn’t much fun.
The S&P 500 finished the week down about 2%. Under that, XLK fell 7.7%, the semis ETF SMH fell 10.5%, cybersecurity fell 10%, software fell 7%. Staples, energy, and healthcare all went up 3 to 5 percent. Half the index is still above its 200-day. Equal-weight beat cap-weight. This was a tech beating, and the people who are underwater this week are underwater in the exact sector where the fear just got priced.

Three ideas, then the tool
A put is a floor
A put gives you the right, not the obligation, to sell 100 shares at a fixed price (the strike) until a fixed date. You pay a premium up front.
Own 100 shares and buy one put and you've built a floor. Below the strike, every dollar the stock loses is a dollar the put gains. Above the strike, the put does nothing and expires worth zero. The premium is gone either way.
Three things follow:
- The floor is at the strike. Your entry has nothing to do with it. A $50 put on shares you bought at $62 protects you below $50. The $12 between $62 and $50 is already yours.
- Protection costs money every day. The premium decays with time. A put you buy and never need is a pure expense. Fine when you're insuring a gain. A bad trade when there's no gain to insure.
- A put only caps what you can lose from here. It doesn't help with the price the stock has to reach for you to be whole. It raises that price by the premium, because now you have to earn that back too.
Delta, in one paragraph
Ignore the next 3 paragraphs if you’re seasoned, but I haven’t chatted Greeks in a minute.
Delta is how much an option's price moves when the stock moves one dollar. A put with a delta of negative 0.30 gains about 30 cents when the stock drops a dollar and loses about 30 cents when it rises a dollar. Calls have positive delta, puts negative, and 100 shares of stock are exactly +100. Clear as mud? That’s how they like it.
It does two jobs. As a rough probability: a 30-delta put is roughly a 30% bet the stock finishes below that strike at expiration. A 50-delta put is at the money. A 10-delta put is a lottery ticket against a crash. As a measure of how much of the move you still own: add up every delta in the position. 100 shares plus one 30-delta put is about +70, so you still catch 70% of every move, up or down. Sell a 30-delta call against the same shares and you're at +70 from the other side. Do both, a collar, and you're around +40.
The trap: people hear "30-delta put" and think "I'm 30% protected." You're not. Delta is how much the put moves today, for a small move. Protection is what the put is worth at expiration, at the price you're scared of.
Your basis changes the answer
Here's the whole post in one example.
You bought 100 shares at $62. The stock is at $53. You're down $900.
The advice is "buy a put." The chain shows a 30-delta put at $49 for $1.80. You buy it.
What did you do? You paid $180 so the worst case is now $13 a share, $62 down to the $49 floor, plus the $1.80 you just spent. Call it $14.80 a share, $1,480, as the most you can lose. That's real, and if the stock goes to $30 you'll be glad. Now the other side. If the stock goes nowhere, you're out the $180. If it claws all the way back to $62, you're even on the shares and still out the $180, so the price where the whole position is back to zero just moved from $62 to $63.80.
(62.00 + 1.80) = $63.80 recovery, versus $62.00 doing nothing
The put didn't lock in your loss. You still own the shares and they can still recover. It capped the loss and raised the recovery price, and when you're down, that's backwards. There's no gain here to protect. There's a hole, and you just made it $1.80 deeper.
Now flip it. Same 100 shares, bought at $40, stock at $53. You're up $1,300. That same $49 put now protects a real gain: the floor is $9 above your basis. Paying $180 to lock in at least (49 - 40) x 100 - 180 = $720 of your $1,300 profit is a perfectly sane insurance decision. Nothing changed but what you paid, and the verdict flipped.
When buying a put is actually right
Four situations.
- You have a gain to defend. Basis below the current price, you want to keep most of the upside and cap the downside through a window. That's what the Hedge Shopper in Ticker Lab is for.
- There's a dated risk inside the window. Earnings, a lockup expiry, a court date, a macro print. You're hedging a day, and short-dated protection is cheap next to standing insurance. Up on the shares, it's often worth it. Down, keep reading.
- You can't sell the shares. Restricted stock. A long-term holding period that clears in three weeks. A concentrated position that would move the stock if you dumped it.
- You're making a bet, with no shares under it. A put with no stock is a directional trade that the thing goes down, and the Strategist in Ticker Lab ranks long puts and bear put spreads for it by probability of profit.
The case where a put is wrong is the one we were all tempted to buy this week: underwater, no dated event, no reason you can't sell, and you feel sick looking at it. A put charges you for that feeling and leaves it exactly where it was.
What the Position Doctor does
The Doctor asks for two numbers: how many shares you hold, and what you paid per share. Then it reads the live option chain and does three things.

- It diagnoses the position. More than 2% under your basis is underwater. Within 2% either side is near basis. More than 2% above is in profit. Underwater means repair first, then income, then protection-plus-income, then protection last. Near basis means income first, because there's nothing to defend and nothing to repair. In profit means protection first and repair last.
- It prices five structures off the real chain. Each on its own horizon, because they do different jobs. Income structures want time decay working for you, so they go short, about 35 days. A repair needs the stock to have room to travel, so it goes long, about 75 days. A protective put is standing insurance, so it sits in the middle, about 60 days.
- It measures every candidate against what you paid. The current price is only the starting point.
One thing it doesn't do yet, and this week it matters: it doesn't know about earnings. If a report lands inside a structure's window, implied volatility gets crushed after it, which hurts the long legs and helps the short ones. We're in earnings season. Check the date before you pick a horizon.
The five structures
I’m not going to go into the rest in detail other than the fifth, because I’ve made this post too long as it is, and I’ve written about the rest before.
-
Protective put, around 30 delta
-
Covered call, income, same 30 delta
-
Covered call, ATM, crawling out
-
Collar, pay for the floor by selling the cap (buy a put, sell a call, usually my go-to if I can get it early enough and I do it as a calendar spread)
And the last, for my heavy dose of alpha:
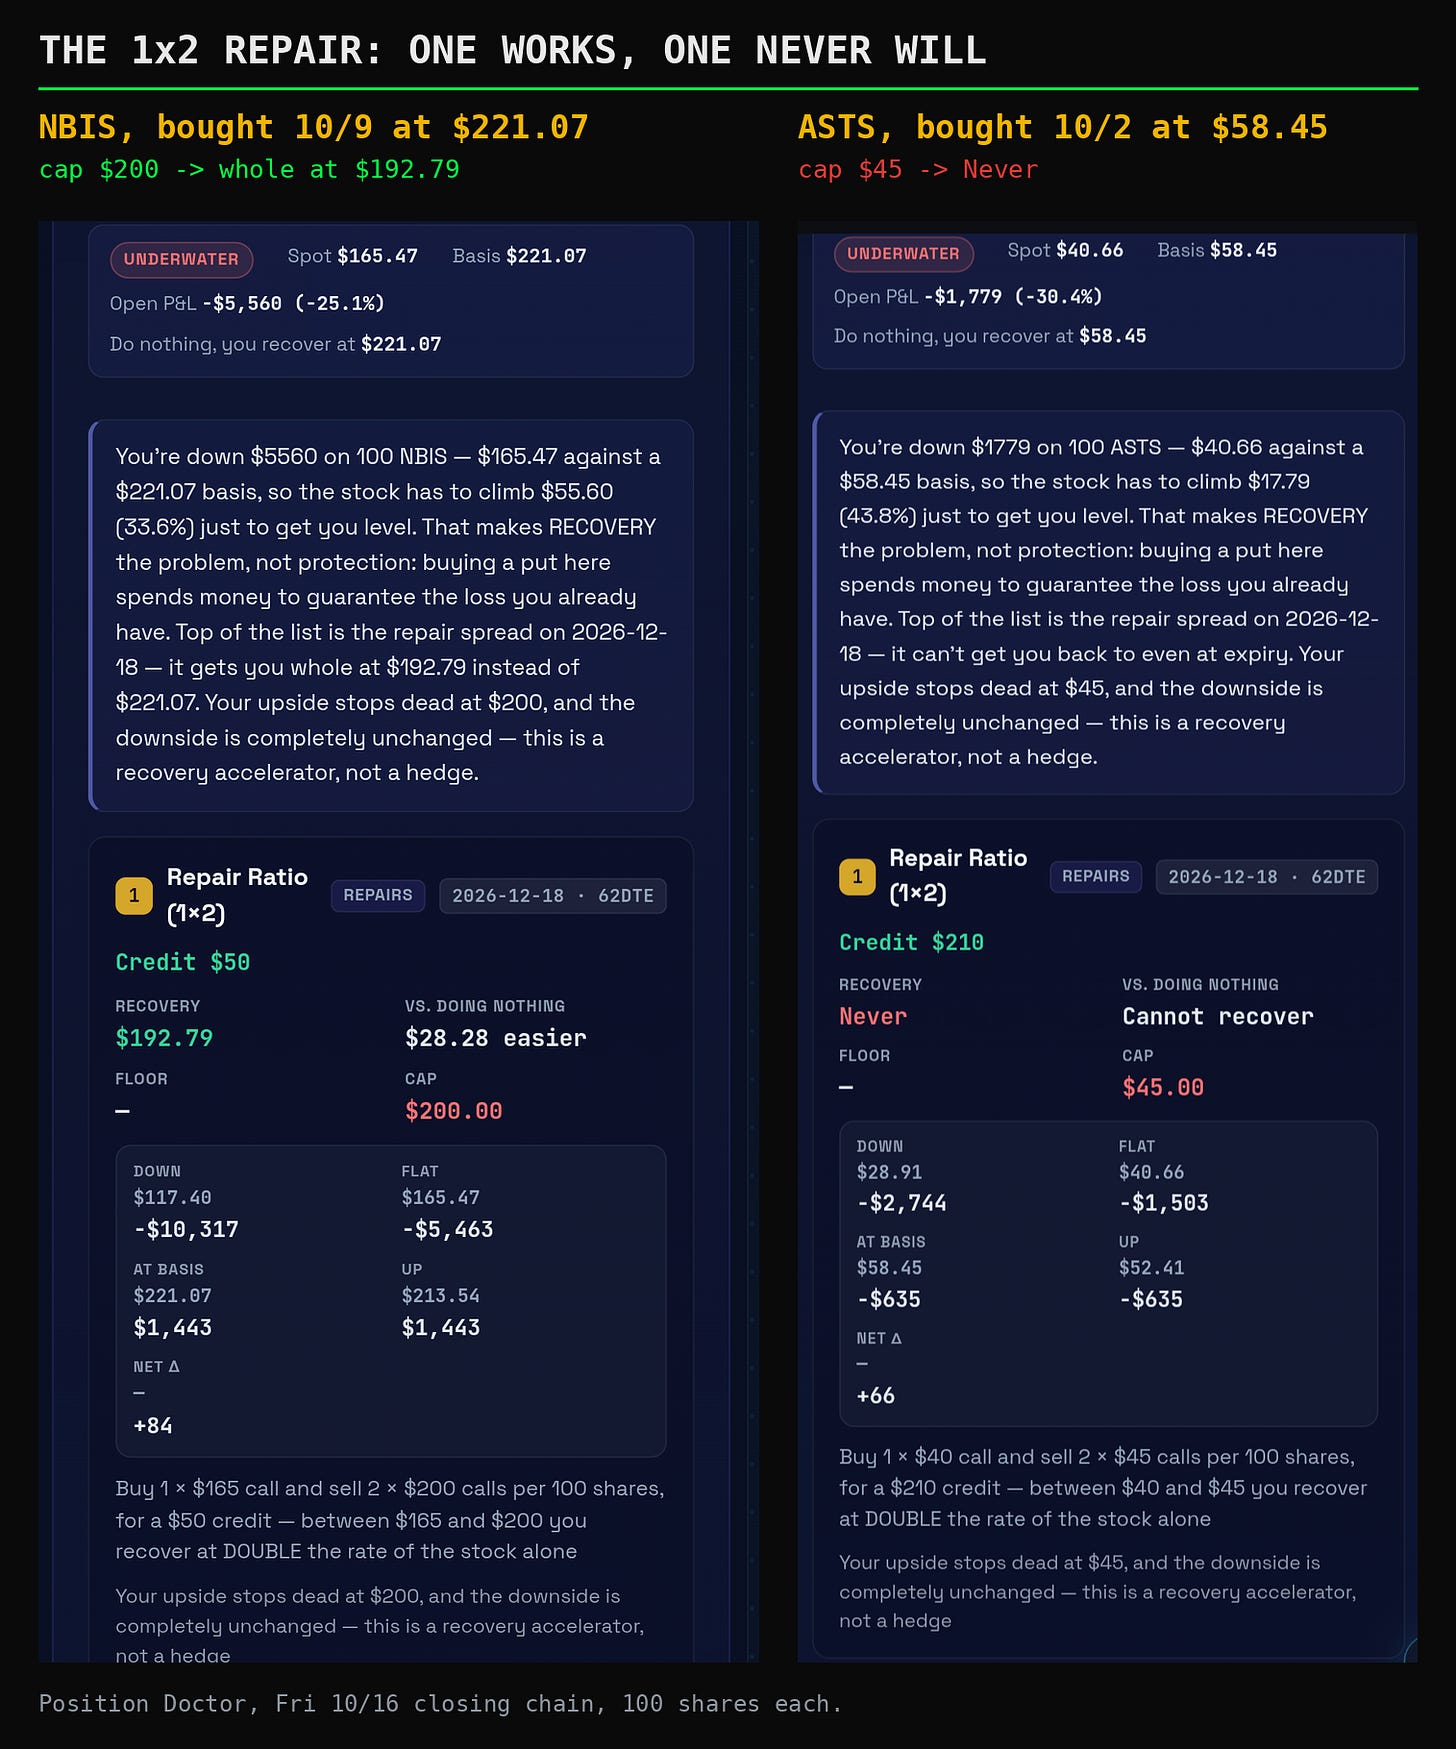
Repair ratio, the 1 by 2. Recover twice as fast.
Per 100 shares: buy one call at the money, sell two calls at a higher strike. The two short calls pay for the one long call, so the structure is usually a small credit or close to free. One short call is covered by the long call, the other by your shares, so there's no naked upside.
What it does: Between the two strikes you own 200 shares' worth of upside instead of 100. The stock only has to climb half as far to get you back to even.
What it costs: Your upside stops dead at the upper strike. Above it the shares get called away and the extra call cancels the extra gain. And the downside is completely unchanged. Don't mistake it for a hedge.
Worked example, with the arithmetic typed out because I got it wrong the first time: 100 shares at $62, stock at $53. Buy one $53 call, sell two $58 calls, roughly even money. Between $53 and $58 you make $2 for every $1 the stock moves.
At $58 on expiration:
  Long $53 call        $5 x 100  =  $500
  Two short $58 calls             =    $0
  Shares, $53 to $58   $5 x 100  =  $500
  Total gain                        $1,000
  The hole                           -$900
  Net                                 +$100
You're whole at $57.50 and out with a small profit at $58, instead of needing $62. My first draft had the gain at $1,500. It's $1,000. The conclusion survived and the number didn't, which is why the arithmetic goes in the post.

The Doctor picks the highest upper strike whose two short calls still pay for the long call. Higher cap, more room to run. The trade-off is that a lower upper strike collects more credit, and credit lowers the recovery price. The card shows both so you can pick.
The sixth one. The hardest. Sell the damn shares.
The Doctor doesn't price this one, because it isn't an options structure around shares you keep. It's here because it's what I'd do with some of the names that got hit this week, and leaving it out of a post about getting back to even would be dishonest.
Sell the shares. Book the $900 loss. Then sell a cash-secured put at the strike you wish you had bought at in the first place, 35 days out, and collect premium while you wait. Please know early assignment can trigger wash sales - tread carefully, not financial advice.
In the example: sell at $53, sell the $50 put for, say, $1.20. If it expires worthless you made $120 on $5,000 of collateral in a month and you still don't own a stock that was going down. If you get assigned, your new basis is $48.80, and the climb back to your old $62 is now a climb from $48.80, with premium paying you every month along the way. The hole is the same $900. What changed is that your capital is earning rent at $50 instead of praying at $62.
50.00 - 1.20 = $48.80 new basis if assigned, versus $62.00 holding

This also harvests the loss for taxes, which none of the five structures do. One caution, and it's a real one: **if you buy the shares back inside 30 days, or get assigned inside 30 days, the loss doesn't disappear, it gets deferred into the new basis.**Buying a call on the same name inside that window does the same thing. So the sell-and-wheel and the repair ratio are mutually exclusive for a month. I did corporate accounting for a living and I still check this every time.
That's the premium seller's answer: become the casino and get rich slowly. The other five are for when, for whatever reason, you're not ready to let the shares go.
Where to find it
Open any ticker in Ticker Lab and scroll to "More on SYM." The Doctor is the last card. The Trade Journal's Positions page also has a Diagnose link on every lot of 100 shares or more.
Try it on ASTS yourself in the ASTS Ticker Lab.
Ticker Lab lives on tradermatrix.pro (that's my referral link), and the walkthroughs are on youtube.com/@TraderMatrixHQ.
The Doctor is a Premium tool. If this week put you underwater and you want the numbers instead of the feeling, that's what the subscription is for.
$NBIS and $ASTS, one week vs two
Two names, two entry dates: the Friday close on October 2, or a week later on October 9. All numbers are the Doctor off Friday's closing chain, 100 shares.
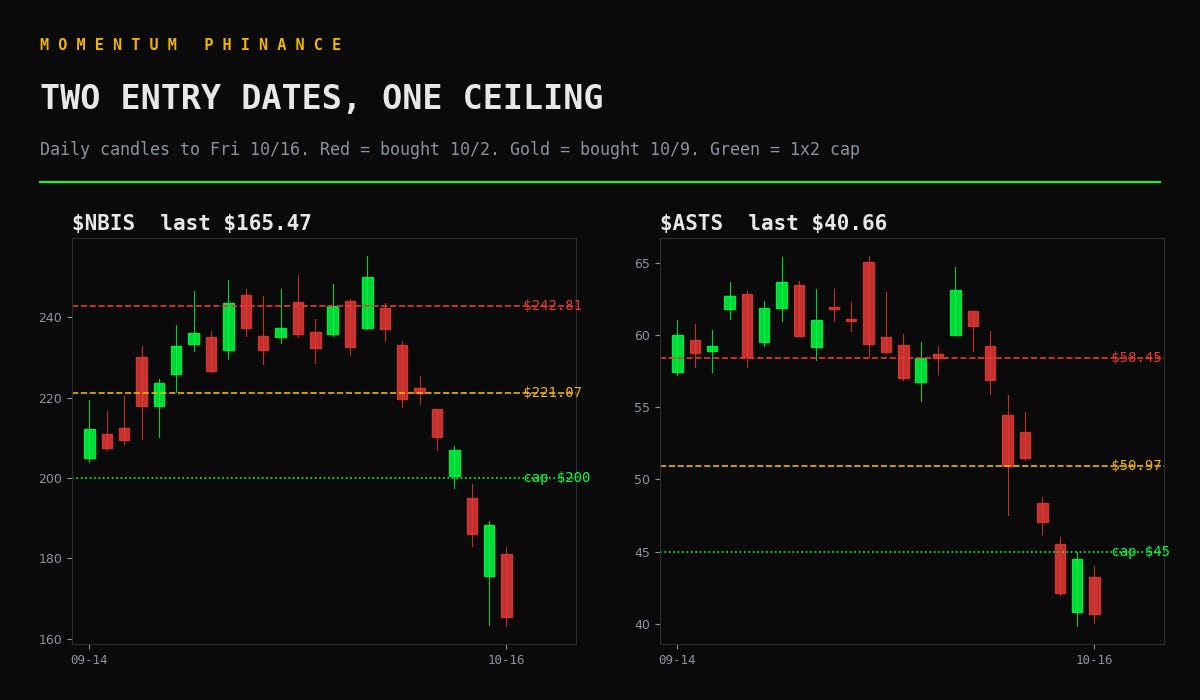
$NBIS, closed Friday at $165.47
Bought October 2 at $242.81. Down $7,734, needs 46.7%. A put pushes your recovery up to $256.89. Selling the call at basis pulls it down to $240.61. The 1x2 (December $165/$200, $50 credit) can't get you whole, but at $200 it leaves you down $731 instead of $4,281.
(200 - 242.81) x 100 = -$4,281 doing nothing at $200
-4,281 + (200 - 165) x 100 + 50 = -$731 with the repair
Bought October 9 at $221.07. Down $5,560, needs 33.6%. Same 1x2, same strikes, same $50 credit: whole at $192.79, and up $1,443 at $200.
(S - 221.07) + (S - 165) + 0.50 = 0, so S = $192.79
The strikes and the credit didn't change. One week of entry price is the difference between "cannot recover" and "whole at $192.79."
$ASTS, closed Friday at $40.66
Bought October 2 at $58.45. Down $1,779, needs 43.8%. The 1x2 (December $40/$45, $210 credit) can't get you whole. At $45 it leaves you down $635 instead of $1,345.
Bought October 9 at $50.97. Down $1,031, needs 25.4%. The same 1x2 gets you whole at $44.44. Here even the plain 30-delta $50 call works: its cap is 97 cents under your basis, but the $1.80 premium covers the gap, so assigned at $50 you're up $83.
(50 - 50.97) x 100 + 180 = +$83 if the $50 call is assigned
(S - 50.97) + (S - 40) + 2.10 = 0, so S = $44.44

The repair ceiling
You can tell whether a 1x2 can ever get you whole with one line of arithmetic. At the short strike, the shares and the long call have both paid you everything they're going to, and that's as good as it gets. So the highest basis a repair can rescue is:
2 x short strike - long strike + credit per share
NBIS: 2 x 200 - 165 + 0.50 = $235.50. The October 9 basis of $221.07 is under it, so the repair works. The October 2 basis of $242.81 is over it, so the repair cannot.
ASTS: 2 x 45 - 40 + 2.10 = $52.10. $50.97 is under it. $58.45 is over it.
If your basis is above the ceiling, the 1x2 shrinks the hole and that's all it does. That's where selling the shares and wheeling the put comes back into the conversation, because the repair already told you it can't finish the job. These are December structures, so look up both earnings dates before you put either one on.
Plug your own basis into the NBIS lab or the ASTS lab and check which side of the ceiling you're on.
~ Michael