
I Checked Whether The Gamma Flip Actually Predicts Anything

Michael speaking here - I did have AI write the below so I could get it out prior to market open for anyone day trading $SPY 0DTE’s. Important part is in the picture at the bottom that I used for the hero.
SPY spent Wednesday afternoon doing nothing. Three hours pinned around 767.80, the kind of tape where you start drawing on the chart just to feel productive.
So I drew. Every place the put/call gamma ratio flipped, I dropped a vertical line.
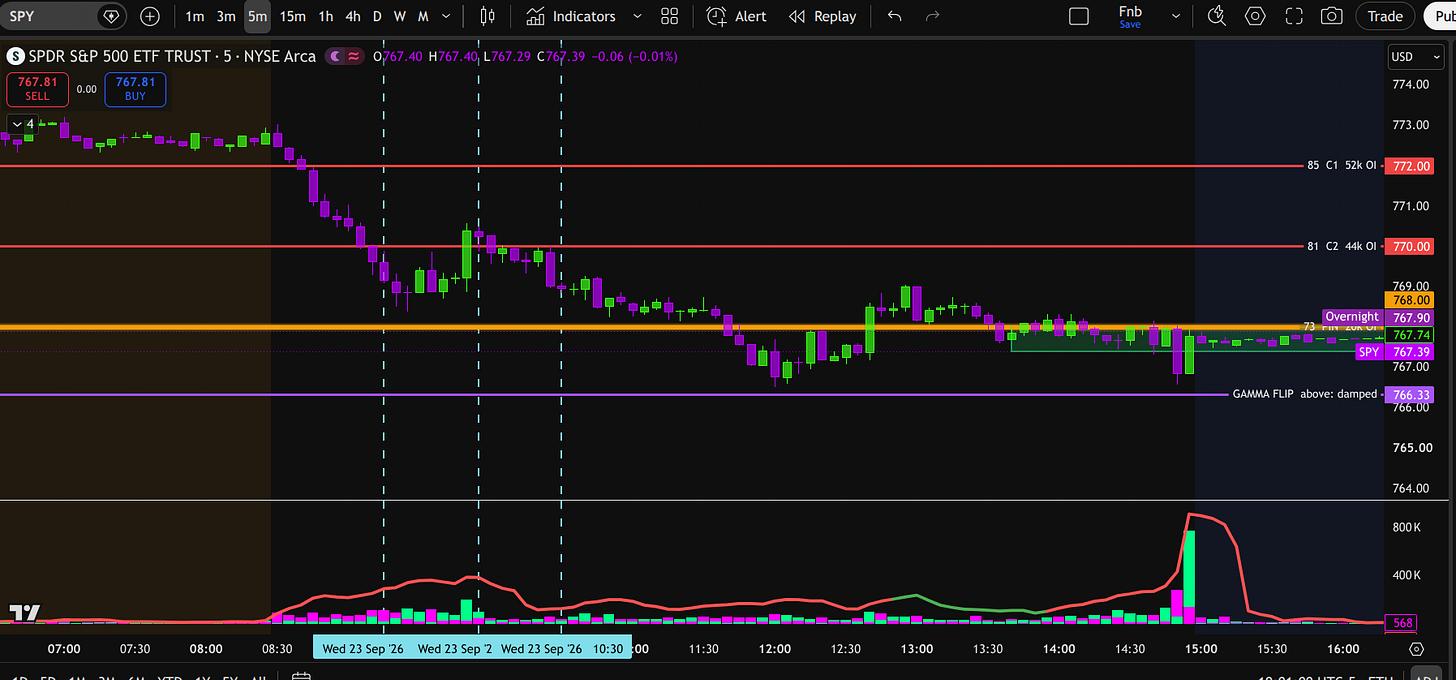
Then I did the part nobody does, which is check.
One signal wearing two costumes
I pulled 1,954 one-minute snapshots, five sessions, and compared the two things I thought I was watching. The put/call GEX ratio and the distance from the gamma flip.
They are the same number. Correlation of -0.98. "Ratio above 1" agreed with "price below the flip" on 1,953 of 1,954 snapshots. That is 99.95 percent.
So my three lines were not confirming each other. They were the same line drawn three times, and I had been nodding along at my own echo.
And the crossings did nothing
Eighteen crossings on the day. Here is what price did after each one, signed by the direction of the cross:
-
15 minutes later: down 0.5 basis points, 44 percent hit rate
-
30 minutes later: down 0.3 basis points, 39 percent
-
60 minutes later: down 0.7 basis points, 33 percent
One SPY point is 13 basis points. These are four cent wiggles with a coin flip attached. If anything the signal was mildly wrong.
The part I actually needed to see
Then I looked at the other four sessions and found zero crossings. None on the 17th, 18th, 21st, or 22nd.
Price was below the flip all day on the 17th and 18th. Above it all day on the 21st and 22nd. The regime changed over a weekend gap, not during a session.
That reframes the whole thing. The gamma flip is not an intraday trigger. It is a positioning flag you check once, before the open, to know which kind of day you are in. Wednesday was the rare day it hovered right on top of price, and hovering is exactly when it has nothing to tell you.
I had been treating a daily state variable like a scalping signal.
So what do you do with it
You use it the way you use a map, not a stopwatch. Here is tomorrow's, built off the book as it closed:

Net gamma reset to negative 2.09 billion at the bell when Wednesday's expiring contracts rolled off. Under 769.22 dealers are short gamma, which means they chase moves instead of cushioning them.
The one that matters to me is the downside. Below 766 the book thins out badly. The only dealer buying between there and 760 is a small positive shelf at 763, and small is the operative word. That is not support, that is a speed bump before the real fight at 760 where 35,000 puts are sitting.
I am not predicting which road. I do not know which road. The map just tells you what happens on each one, and that is worth more than a guess dressed up as a forecast.
~ Michael