Loading...

Research deep dive · 16 min read
How to Use Ticker Search
A complete walkthrough of every section on the Ticker Search page: the seven hero stats, the expiry selector that scopes everything, Options Sentiment, OI Sandwich, Apex levels, Tomorrow's Map, Smart Money, VoPR Scanner, and the options chain. Verified against the real components.
Open the tool →Hey guys, Art from TraderMatrix here. The page I want to walk through is Ticker Search, found under Research in the nav. It lives at /ticker-search and it is the page where a name either earns a trade or gets dropped. You type a symbol, hit Search, and the platform hands you fifteen sections about it. This guide covers what each section actually shows, which ones matter most, and how to move through the page without spending forty minutes on it.
The short version:
- Set the expiry you intend to trade BEFORE reading any number on this page. Sentiment, expected move, Apex levels and the gamma profile are all scoped to the selected expiration.
- The Options Sentiment score blends three signals: C/P Volume (40%), P/C Open Interest (35%, inverted), and IV Skew (25%). All three agreeing is the clean case. When they split, the market is at odds with itself.
- Apex level strength (0 to 100) measures dealer-hedging concentration, not the probability of price reaching the level.
- Smart Money is Congress disclosures, Form 4 insider filings, and Active ETF flow. It is not an options flow history table and it does not have filters or a CSV export.
- View Flows in the header goes to the per-ticker live flow tape, where you count the aggressive prints. That is the print-counting tool, not this page.
What this page is and what it isn't
Most people arrive here after seeing a name on Unusual Activity or the Flow Heat Map. They want to know whether the name is worth acting on. Ticker Search is where that question gets answered, section by section.
It is not a live feed. It does not surface alerts or score individual prints. What it does is give you everything you need about one specific ticker in one place: the current options structure, the dealer gamma landscape, three separate reads on Smart Money positioning, the full options chain, and a volatility scanner that classifies whether premium is cheap or expensive right now.
The thing that trips people up most is that nearly every options-derived number on the page is scoped to the expiration currently selected. Change the expiry and the Sentiment score changes, the expected move changes, the Apex levels change, the gamma profile changes. Same ticker, different instrument. This is why the expiry selector gets covered before anything else below.
What you see when you open a ticker
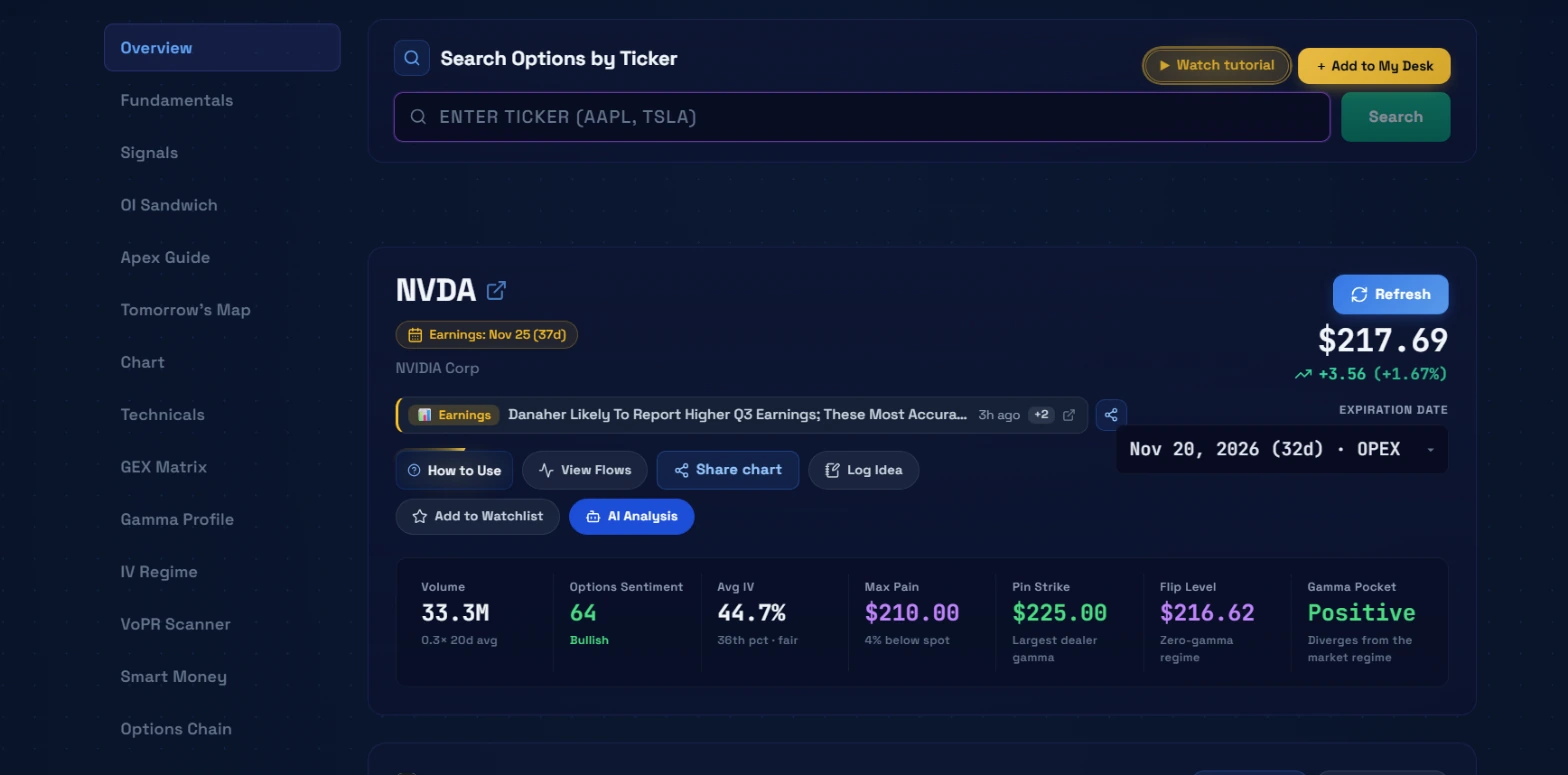 NVDA loaded: earnings in 37 days, expiry set to the Nov 20 OPEX (32 DTE), seven stats across the bottom of the header. The left rail jumps to any of the fifteen sections.
The search box at the top of the page reads "ENTER TICKER (AAPL, TSLA)". Type a symbol and click the Search button.
Once a ticker is loaded, the header area gives you several things before you reach the stats.
The ticker block. Company name under the ticker, current price, and the day's change. An earnings badge appears when there is an upcoming event ("Earnings: Nov 25 (37d)"). That countdown matters for every options position you are considering: if earnings land before your expiry, you are holding through a volatility event.
The news bar. A recent headline with a source tag. Scrollable if there is more than one. Click to open the full article.
Action buttons. How to Use opens the in-app guide sidebar. View Flows opens the per-ticker live flow tape at /live-flow/SYMBOL. Share chart lets you send a snapshot. Log Trade pre-fills a trade journal entry with this ticker's context. Add to Watchlist adds the name to your saved list. AI Analysis runs an AI read on the ticker.
The expiry selector. Shown at the top right of the ticker header with the date, DTE in parentheses, and an OPEX label on monthly expirations. A dropdown arrow lets you switch dates. Set this before reading any stat.
The seven hero stats
Below the action buttons, seven stat cards span the width of the page. These are the numbers I look at first.
Volume. Today's equity share volume and how it compares to the 20-day average. The NVDA screenshot shows 33.3M at 0.3x the 20-day average, meaning this was a quieter-than-usual session for that name. Volume context tells you whether today's price action is happening on participation or on thin tape.
Options Sentiment. A composite score from 0 to 100, with a directional label under the number. Score bands: Strongly Bearish below 25, Bearish 25 to 39, Neutral 40 to 59, Bullish 60 to 74, Strongly Bullish 75 and above. On the NVDA screenshot this read 64 with the label "Bullish." The score needs at least two of the three underlying signals to compute. If fewer than two are available, the page withholds the read entirely. A missing score is not the same as a neutral one.
Avg IV. The current average implied volatility for the selected expiry, its percentile rank, and a label (fair, cheap, or rich). The NVDA screenshot showed 44.7% at the 36th percentile, labeled "fair." The percentile tells you where current IV sits relative to this ticker's own recent history.
Max Pain. The strike where the maximum number of options contracts expire worthless, calculated by total premium at each strike. Shown as a price and how far it sits from current spot. The NVDA screenshot showed $210.00 at 4% below spot.
Pin Strike. The strike carrying the largest dealer gamma exposure, labeled "Largest dealer gamma." On the NVDA screenshot this was $225.00. Dealers who are short gamma at a strike hedge by buying into moves up and selling into moves down, which can pin price near that strike heading into expiry.
Flip Level. The gamma-flip price, labeled "Zero-gamma regime." Above the flip, dealers are long gamma and their hedging dampens moves. Below it, they are short gamma and their hedging amplifies moves. The NVDA screenshot showed $216.62. Spot at $217.69 sat just above the flip.
Gamma Pocket. Shows the gamma pocket regime for the selected expiry, labeled Positive or Negative, with a note on how it relates to the broader market regime. On the NVDA screenshot this read "Positive" with "Diverges from the market regime."
Key point: All seven stats are scoped to the selected expiry. The expiration dropdown is at the top right of the ticker header. Set it before reading any of these numbers.
The expiry selector in practice
The dropdown shows available expirations with the date and DTE. Monthly OPEX dates are labeled with an OPEX tag. Weekly dates show just the date and DTE.
When you switch expiries, every options-derived stat updates: Avg IV, Max Pain, Pin Strike, Flip Level, Gamma Pocket, the Options Sentiment score, the expected move, the Apex levels, the gamma profile, and the options chain. Fundamental data (About, Key Financials) stays the same across expiries.
If you are evaluating a January call and the page is set to the October expiry, you are reading the gamma and volatility picture for a completely different instrument. Nothing on screen warns you. It is a silent error, and it is the most expensive mistake people make on this page.
Fundamentals
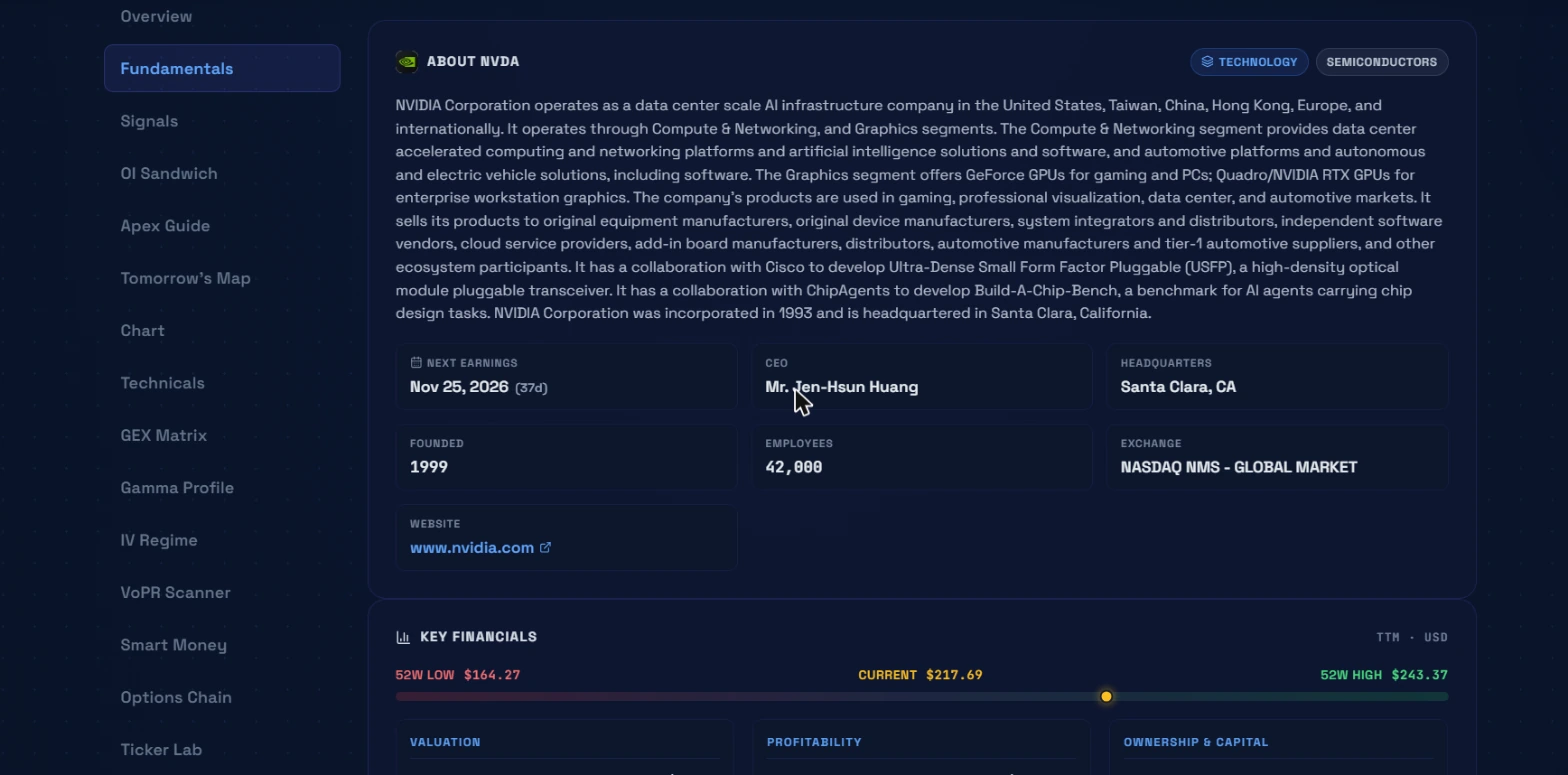 The Fundamentals section: company description with sector tags, six key facts, and the Key Financials block with the 52-week range bar.
The Fundamentals section has two blocks.
About. A plain-English company description with sector tags (the NVDA screenshot shows TECHNOLOGY and SEMICONDUCTORS). This is where you read whether you would want to own this stock if assigned shares, which matters on any trade that carries assignment risk.
Key Financials. A 52-week range bar showing the low, the current price, and the high. Below the bar, three subsection categories: Valuation, Profitability, and Ownership and Capital. The Ownership block includes Short % Float. There is no Days to Cover on this page.
Most of the time I scroll past Fundamentals quickly on names I already know. The section earns a proper read when I am evaluating a put sale and need to ask honestly whether I would hold the stock if assigned.
Signals
The Signals section breaks the Options Sentiment score into its three components as separate bars.
The formula: C/P Volume ratio gets 40% of the weight, P/C Open Interest ratio (inverted) gets 35%, and IV Skew gets 25%. The section renders all three as separate bars alongside the composite score, so you can see exactly which signal is pulling the number in which direction.
The interesting case is divergence. If C/P Volume is bullish (fresh call buying today) while P/C Open Interest is bearish (existing put positioning from prior sessions), the two markets are pointing opposite ways. Fresh buyers think the name is going up. The accumulated book has more put exposure than call exposure. That combination can set up a squeeze: if price runs, the existing short interest and protective puts have to be covered into the move.
IV Skew tells you which direction the market has already made expensive. High put skew means downside is priced in heavily, so buying puts costs more than buying calls for a comparable move. The same bearish thesis expressed as a put spread becomes cheaper than a naked long put when skew is steep on the put side. This is not about whether the thesis is right. It is about whether you are paying a fair price to express it.
Try this: When Signals show divergence (for instance, P/C OI bearish while C/P Volume is bullish), note which direction the fresh money is flowing versus where the accumulated positioning sits. Fresh institutional call buying against an existing put-heavy open interest structure is one of the more reliable squeeze setups in this data.
OI Sandwich
The OI Sandwich section sits right after Signals in the rail, before you ever reach the chart. It shows the open-interest-weighted center of mass of the chain, and the put-centroid-to-call-centroid band surrounding current price.
Gravity center. The OI-weighted average strike across the full chain, both puts and calls. This is where the most total open interest concentrates, weighted by notional size.
Sandwich floor and ceiling. The put centroid (OI-weighted average of all put strikes in range) sets the floor. The call centroid sets the ceiling. Together they define a band. When spot is inside the band, the structure compresses price. When spot is outside, it is overextended in one direction.
Snap Score. A 0 to 100 composite for OpEx pin-back risk. Higher means more structural pressure to snap back toward the gravity center by expiry. A low snap score means price sits close to the gravity center and the structure is not stretched.
OverextDir. Whether price is ABOVE, BELOW, or PINNED relative to the sandwich band. PINNED means spot sits inside the band. ABOVE or BELOW indicates overextension in that direction.
This section is how I judge whether a target is structurally reachable. A target sitting at the sandwich ceiling on a PINNED read, with the gravity center below current price, is a different proposition than a target clearing the ceiling on a name where price is already ABOVE the band and the snap score is elevated.
Apex Guide
The Apex Guide section sits in the rail right before the Chart. It is a plain-English explanation of what the Magnet and Level labels mean on the chart below. The guide describes each label once, so you read it once rather than guessing at the chart cold. Worth reading the first few times you are on the page.
Chart
The Chart section is a 90-day candlestick with Apex magnet levels drawn on it. The on-screen heading reads "Apex Levels · 90 Day." There are no flow-event markers on this chart anywhere.
The levels use two labels. "Magnet" is the rank-1 Apex level, the strike carrying the highest dealer-hedging concentration for the selected expiry. Everything else is labeled "Level." Each level shows a strength score from 0 to 100. That score measures how much dealer gamma concentrates at that strike. A strength of 91 means dealer positioning is heavily concentrated there. It does not mean there is a 91% chance price reaches the level.
The gamma flip level is also marked on the chart, distinct from the Apex levels.
Tomorrow's Map
Tomorrow's Map replaced the older entry-timing panel. It shows three gamma roads out of the current price: one up, one sideways, and one down. Each road has stops that describe what dealer gamma does to price at that zone. Under the road diagram, an IF / IF / ELSE conditional plan lays out what each scenario means for positioning going forward.
The panel has a "Tomorrow | Next 6 Weeks" toggle at the top. Tomorrow shows the three roads using the gamma structure that survives tonight's expirations. Next 6 Weeks shows the gamma walls across the upcoming monthly expirations and a fixed-rule plan for the broader window.
When the options book for the ticker is too thin to map (insufficient open interest to build the gamma roads), a simpler Entry / Stop / Target plan renders instead.
The plans in this section are structural rules derived from the gamma landscape. They are not a track record and not financial advice.
Technicals
The Technicals section shows the full indicator stack: trend from EMAs, momentum from RSI, MACD, Stochastic %K, CCI, and Williams %R, plus ATR for volatility context and volume context. The Oscillator Matrix table brings all of them together in a single grid with each indicator's current reading. A plain-language summary ties the readings together.
GEX Matrix
The GEX Matrix shows gamma and vega exposure aggregated across strikes, with a Daily / Weekly / Monthly toggle. This section is most useful when implied volatility is doing significant work on the name, or when you want to see how the gamma structure changes across time horizons.
Gamma Profile
The Gamma Profile shows dealer gamma exposure strike by strike for the selected expiry. Tall bars above spot represent strikes where dealers have heavy gamma concentration on the call side. Tall bars below spot show put-side concentration. The flip level is marked on the profile. Where the bars are tallest is where dealer hedging pressure is densest, which is typically where price stalls, absorbs, or rejects.
IV Regime
The IV Regime section classifies whether implied volatility sits in a high, neutral, or low regime relative to realized volatility. It includes a historical comparison so you can see how current premium levels relate to the recent past. Use this to understand whether you are entering a period of elevated or suppressed premium before picking a structure.
VoPR Scanner
VoPR stands for Volatility Premium. This section compares implied volatility to realized volatility across four estimators and returns one contract recommendation per trade type, each graded A through F.
The grade comes from several inputs: the vol edge between implied and realized, IV rank, liquidity at the strike, the broader vol regime, where price sits in its channel, and whether the strike clears the necessary bands. Every recommendation card explains what drove the grade.
One hard floor: the VoPR scanner needs at least 30 bars of price history before it can classify the vol regime. Below that floor the regime reads "unknown" and grades are unavailable. A name too new for the scanner simply shows as unclassifiable. This is not a bug and there is no workaround.
Smart Money
Smart Money is three distinct blocks, each with a different window and data source.
Congress (90 days). Disclosed trades by US elected officials and their immediate families, filed under the STOCK Act. These are public filings. The 90-day window catches recent positioning.
Form 4 Insider Trades (21 days). Corporate insider buys and sells filed with the SEC. A scheduled 10b5-1 sale reads differently from an unscheduled open-market sale, and the section notes which type it is. Twenty-one days is a tight window; older filings drop off quickly.
Active ETF Flow. Whether actively managed ETFs are adding or trimming the name, with a conviction score built from fund count, provider count, and average weight change. A conviction score of 6.8 with five funds adding means multiple separate active managers made the same call.
This section is not a flow history. There are no options prints, no premium amounts, and no score filters here. Reading it as a substitute for View Flows means you never actually count the aggressive options activity. The print count happens on the live flow tape.
Watch out: People open Smart Money expecting to see options prints with premium amounts and scores. They are looking at three non-options data sources instead. For print counting, use the View Flows button in the header.
Options Chain
The Options Chain section shows calls and puts strike by strike: last, bid, ask, volume, open interest, IV, delta, theta, gamma, vega, and a Breakeven column that factors in the premium paid. Each row has an "Open in Ticker Lab" link that carries the contract directly into Ticker Lab for payoff modeling.
The chain is the confirmation step, not the starting point. By the time I reach the chain, I already have a target strike from the Apex levels, a rough DTE from the expected move, and a read on whether premium is cheap or expensive from the Avg IV percentile. The chain is where I check that my intended strike has reasonable volume and open interest, and that the bid-ask spread is tight enough to trade without paying excessive slippage.
Three ways to work the page
Validating a flow alert. You spotted a name on Unusual Activity. Open Ticker Search, set the expiry that matches the incoming flow's DTE, then read Options Sentiment. If C/P Volume and P/C OI both confirm the same direction as the flow, three independent signals are aligned. Check Smart Money to see whether any of its three blocks point the same way. Then look at the Apex levels for a target that sits inside the expected move. This is the standard validation pass.
Evaluating a position before earnings. Set the expiry to the first monthly after the earnings date. Read Avg IV and its percentile rank. If IV is above the 70th percentile, premium is expensive and selling spreads may cost less than buying directional options. Read the IV Skew bar in Signals to see which direction the chain has already priced most heavily. Check Max Pain to see where the chain wants price to settle.
Finding the stop and target. Open the Chart section. The Magnet level is your target. The put wall below spot is your stop level. Confirm the target sits inside the expected move, since if it does not the market's own estimate is against you. Check which side of the flip level you are entering from, because that determines whether dealer hedging works with you or against you once the trade is on.
Common mistakes
Reading numbers before setting the expiry. This is the most common error. Someone opens a ticker, reads the Avg IV, the Sentiment score, and the Flip Level, then buys a contract expiring weeks later on a different date. Every number applied to the expiry that was selected, not the one they traded. Nothing on screen warns them. The fix is simple: look at the expiry selector before reading anything.
Treating Smart Money as a flow feed. The Smart Money section shows three non-options data sources. There are no prints, no premium amounts, and no scores. Reading it as if it were a flow history means you never count the aggressive options activity. That count happens on the View Flows tape.
Using the Apex level strength score as a probability. A level with strength 91 is not 91% likely to be reached. The score measures how concentrated dealer gamma is at that strike. High concentration means price is likely to interact with that level when it approaches. It says nothing about whether price will approach.
Checking all fifteen sections and ending up less certain. Fifteen sections is enough data to argue yourself into or out of anything. People spend forty minutes here, finish with more doubt than they started with, and then trade on the last thing they read rather than the most important thing they read. Run through Signals, OI Sandwich, Apex levels, and Smart Money in order. Open additional sections only when a specific question comes up that one of them answers.
Ignoring the snap score on OI Sandwich. A high snap score near OpEx means structural pressure to pin price back toward the gravity center. Holding a directional position into expiry with a high snap score and a PINNED overextDir reading is betting against that pressure.
What the page doesn't tell you
The page shows structure, not catalyst. Apex levels tell you where dealer gamma concentrates. They do not tell you when price will move toward those levels or what will cause the move.
Smart Money disclosures lag the actual trade. A Congress filing appears after the position is already on. It shows you what insiders thought when they filed. Form 4 insider sales include scheduled 10b5-1 plans that were set up months in advance. Context matters on every filing.
The Options Sentiment score needs two of three signals. On tickers with thin options volume, one of the three inputs might be unavailable. The score computes from only two components in that case, and the page shows the score without flagging that one was missing.
How it fits with the other tools
Something else gives you the name. This page decides whether the name survives the check. Then another tool turns it into a structure you can actually send.
Unusual Activity and the Heat Map are where most names originate. Every ticker on the Unusual Activity feed links directly here. The alert gives you a name and a print. This page either builds a case around it or drops the idea in a few minutes.
Ticker Lab is where the structure gets built. Once you have a target strike and expiry from this page, the Options Chain's "Open in Ticker Lab" link carries the contract directly into the payoff modeler. That is where you check whether the payoff at expiry makes sense at the price levels the Apex chart is showing.
Live Flow (per-ticker) is accessible from the View Flows button. It is the print-counting tool. Fifteen sections on this page and not one of them counts the aggressive options prints. That is what View Flows is for.
Trade Journal gets the note. The Log Trade button pre-fills an entry with the ticker. Record the flow count, the Apex level target, and the expiry. Twenty trades later you will have data on whether your research criteria are finding real edge.
A practical session routine
Before the open, I pull two or three names that appeared on Unusual Activity or the Heat Map the prior session. For each one I set the expiry to match the window the incoming flow was targeting, read the seven hero stats, then check Signals and the Apex Chart. If a name clears that pass, I note the Apex levels as my target and stop. I do not go deeper into Fundamentals or the full chain at this stage.
During the session, when one of those names starts moving, I go back to Ticker Search and check whether the Sentiment score has changed, whether the gamma profile looks different near the level I was targeting, and whether Smart Money has anything new. If the read is still clean, I check the chain to confirm liquidity at my strike before committing.
The page is the middle of the process, not the whole thing. A name needs to come from somewhere for it to be worth researching, and a structure needs to go somewhere after you decide to trade it.
Options trading carries substantial risk of loss, including potentially the full amount of premium paid. Nothing in this guide is a recommendation to buy or sell any security. Apex level strength measures dealer-hedging concentration, not probability. All options metrics on this page are specific to the selected expiration. Do your own research and manage your position sizing carefully.