
Markets & Smart Money deep dive · 17 min read
How to Use the Apex Magnet Scanner
A complete walkthrough of the Apex Magnet Scanner: how dominant magnet levels are scored, what Scan the Market and My Levels do, and how to read the results in real trading sessions.
Open the tool →Hey guys, Art from TraderMatrix here. Today we're doing a full walkthrough of the Apex Magnet Scanner. I want to go deeper than the tooltip descriptions. This tool has a specific logic behind it, the scoring isn't arbitrary, and once you understand how it actually works you'll know which rows deserve your attention and which ones are just noise.
The short version:
- Magnet levels form where options exposure concentrates and forces dealers to hedge mechanically around a strike.
- The dominant level scores on proximity-decayed open interest (55%) and net GEX magnitude (45%).
- Scan the Market is for discovery. My Levels is for monitoring the names you already track.
- The Signal column tells you whether price has tested a level or broken through it. TESTED Nx HOLDING is confirmed evidence; APPROACHING is still a hypothesis.
- Check Vs Flip before sizing any trade. Negative gamma amplifies moves; positive gamma dampens them.
What a magnet level is (and why it moves price)
Before the page itself, I want to make sure we're on the same page about what we're actually looking at. There's a concept page at /learn/apex-levels that covers the dealer mechanics in full, so I won't rebuild the whole framework here. The quick version:
When you buy a call option from a market maker, they're short that call. Their job is to stay neutral, so they buy shares to hedge their delta exposure. As the underlying price rises toward the strike, they buy more. As it falls away, they sell some back. This mechanical buying and selling is delta hedging, and it happens at every strike where dealers carry a significant position.
What happens at strikes where a lot of options are concentrated is interesting. A strike with enormous open interest forces dealers to do a lot of hedging activity around it. When price approaches from below, the buying pressure from dealer hedging pulls price toward the strike. When price sits above and starts falling toward it, the same effect creates a cushion. The strike acts like a gravitational center.
That's a magnet level. Magnet levels are an emergent property of where options exposure concentrates and how dealers respond to price movement. The Apex Levels guide covers what happens when price actually reaches one of these levels and how to read the dealer position around it.
Key point: The magnet effect is mechanical. It comes from how dealers hedge their delta at each strike. Higher concentration means more hedging activity and stronger gravitational pull on price.
The scoring math
The scanner doesn't just flag any strike with high open interest. It scores each strike using two inputs.
Open interest mass (55% weight): the total OI across all contracts at that strike, aggregated across the five nearest expirations. This OI is proximity-decayed before scoring. A strike sitting 20% away from spot has its OI contribution reduced substantially compared to a strike at 5% away. The decay uses an exponential falloff, with an e-fold (the distance where OI drops to about 37% of raw value) at roughly 10% from spot.
In practice this matters a lot. A far out-of-the-money wall with millions of open contracts, the kind you see at deep round numbers on major ETFs, scores lower than a near-spot concentration with a fraction of that OI. Without the decay, the scanner would constantly surface strikes that are technically enormous but practically irrelevant because price isn't anywhere near them.
Watch out: A far-OTM strike with massive open interest scores lower than a near-spot concentration. The proximity decay is intentional. Without it, every scan would surface distant walls that price won't reach for weeks.
Net GEX magnitude (45% weight): the absolute value of net dealer gamma exposure at that strike. Calls contribute positively, puts negatively, by dealer convention. The magnitude captures how much hedging pressure that strike generates regardless of direction.
The 55/45 split tells you something about the intent: OI mass wins, but barely. A strike with modest open interest but intense gamma exposure from short-dated contracts can still score close to the dominant level. That's by design. Gamma is what drives the actual hedging behavior around the strike; OI is the structural weight. A level with both scores at or near 100.
Both inputs are normalized against the maximum across all scored strikes, blended at those weights, and rescaled so the dominant strike always reads 100. Secondary levels get proportional scores. The system keeps the top 8 strikes from this process.
Distance from spot to the magnet: the absolute percentage gap, computed as the absolute value of (spot minus magnet strike) divided by spot, times 100.
The gamma flip uses a price simulation. The system reprices every contract's Black-Scholes gamma across 41 price points spanning plus or minus 20% of spot, sums net dealer GEX at each point, and finds where that curve crosses zero. Above the flip level, dealers are in positive gamma and dampen moves. Below it, they amplify moves. This is computed per-name on each scan, not pulled from an index-level proxy.
Key point: The gamma flip is computed per-name using a live price simulation, not pulled from an index proxy. Above the flip level, dealers dampen moves. Below it, they amplify them. That difference shows up in the Vs Flip column for every row.
The two modes
The scanner has two tabs. They solve different problems.
My Levels works off your tracked tickers. It reads stored snapshots, so checking your whole list costs no extra data calls. The default radius is 2%, meaning only names within 2% of their dominant magnet appear in results. Options are 0.5%, 1%, 2%, or 5%.
Scan the Market runs a live screen of the broader optionable universe, applies liquidity and momentum filters, computes real Apex levels for each candidate, and returns names within a distance band you control. Because it's doing live per-name computations, it runs when you ask it to. Set your filters, click Run Scan, and it executes once. Change a filter and click again for updated results. Deep link to it directly: /apex-magnet-scanner?mode=scan.
The rough rule: Scan the Market is for discovery (finding names you weren't watching that are set up near a magnet) and for post-close planning. My Levels is for monitoring names you already have a thesis on during the session. Using Scan the Market as a real-time intraday monitor doesn't work well because it requires a manual click to update and won't catch mid-session signal changes the way My Levels does.
One thing worth understanding about Scan the Market's distance band: the default minimum is 3% and the maximum is 8%. Names at 0-3% don't show up in the default scan because at that distance the magnet event is arguably already in progress, and the setup window before you'd need to act is very short. Names over 8% are too far out for a same-session play in most market conditions. You can widen or tighten both ends, but the defaults are calibrated around a useful planning horizon for a normal trading day.
The October 1, 2026 screenshots below show the Scan the Market tab.
Try this: Use Scan the Market before the open to build a morning list of names within 3-8% of a dominant magnet. Once the session starts, switch to My Levels and keep an eye on the Signal column as price interacts with levels.
The page top to bottom
The page opens with "Apex Magnet" and a subtitle: "Finds stocks trading close to their own strongest dealer-hedging magnet level right now." Below that, a longer paragraph that ends with the sentence worth keeping in mind every time you open this page: "Proximity to a magnet is a positioning fact, not a trade signal by itself; pair it with a real catalyst or your own thesis."
Underneath the description, links to the Apex Levels concept guide and to your chart overlay settings.
The filter bar in Scan the Market mode
The count pill shows the current result total. On October 1 it showed "12 tickers."
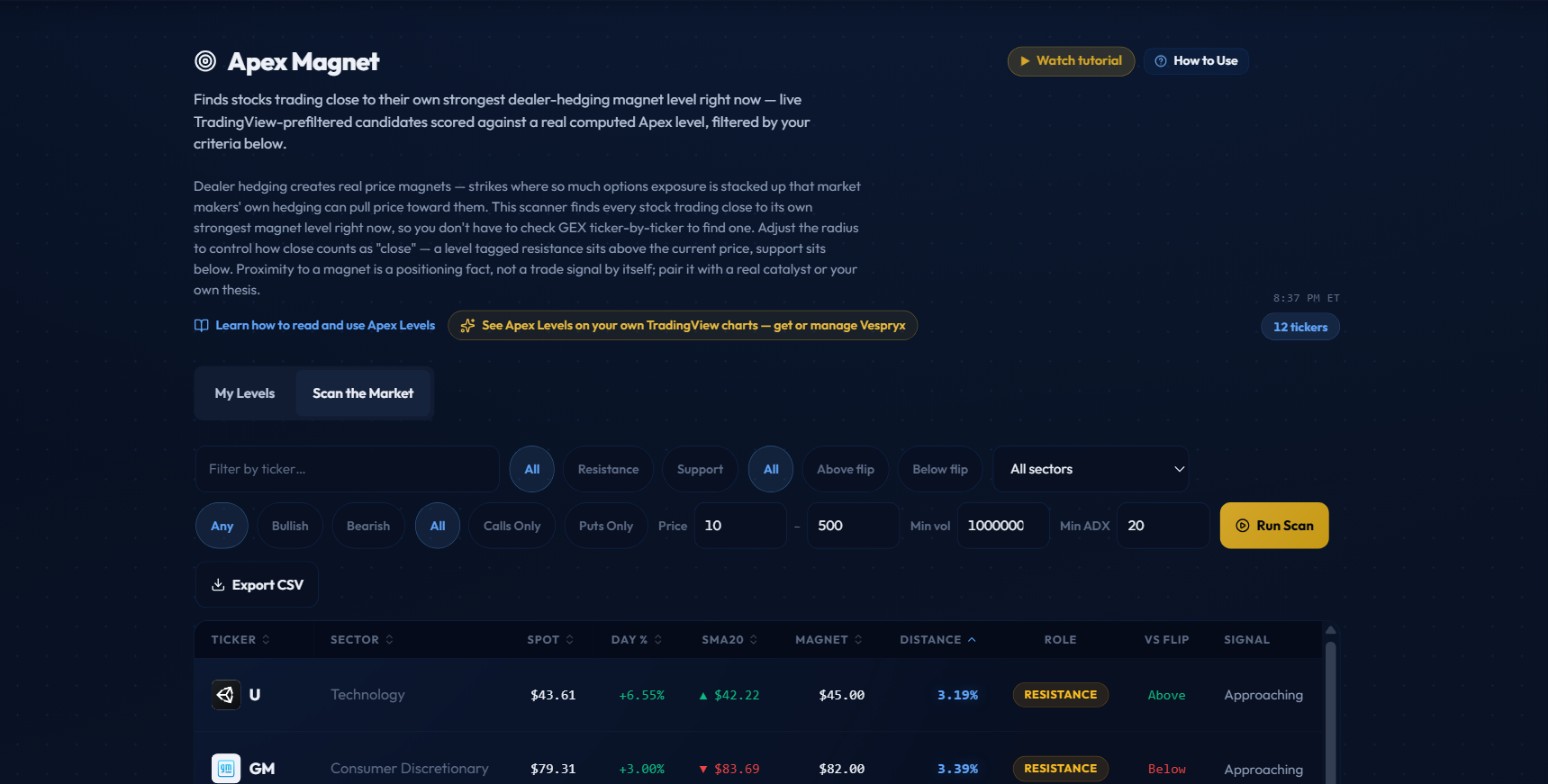 The filter bar and first two rows from the October 1, 2026 post-close scan. Count shows 12 tickers.
Left to right across the toolbar:
- Ticker filter: text input
- Role chips: All, Resistance, Support (narrows to levels above or below current price)
- Flip chips: All, Above flip, Below flip (filters by gamma regime; Above flip = positive gamma, dealers dampen moves; Below flip = negative gamma, moves get amplified)
- Sector dropdown
- Direction chips: Any, Bullish, Bearish (filters by net GEX sign on the dominant level; Bullish keeps call-heavy positioning, Bearish keeps put-heavy)
- Option flow chips: All, Calls Only, Puts Only (more strict GEX sign filter)
- Price range: min and max fields, default $10 to $500
- Min vol: minimum daily volume, default 1,000,000 shares
- Min ADX: minimum trend strength, default 20. At 20 you're keeping names in some directional move rather than dead sideways drift.
- Run Scan: changing any filter does not auto-trigger. You have to click Run Scan.
- Export CSV: includes all table columns, including touch count for the current session.
The results table
The table has ten columns:
| Column | What it shows |
|---|---|
| Ticker | Symbol with company logo. Links to that name's Ticker Search page. |
| Sector | Platform sector classification. |
| Spot | Current price. |
| Day % | Session percentage change. |
| SMA20 | Arrow showing whether spot is above or below the 20-day SMA (up arrow green = above, down arrow red = below), plus the SMA value. |
| Magnet | Dominant apex strike price. |
| Distance | Percentage gap between spot and magnet. Sorted ascending by default, closest-first. |
| Role | Resistance (magnet above price) or Support (magnet below price). |
| Vs Flip | Above or below the gamma flip level. Above = positive gamma, dealers dampen moves. Below = negative gamma, moves get amplified. A dash means no flip was computed. |
| Signal | APPROACHING (level not yet tested), TESTED Nx HOLDING (bounced back N times, still on the same side), or BROKE THROUGH (crossed from one side to the other this session). |
The Signal column anchors on the first stored snapshot of the day, not the most recent one. That way a reclaim that happens later in the session doesn't get misread as a sustained break.
Walking through the October 1, 2026 results
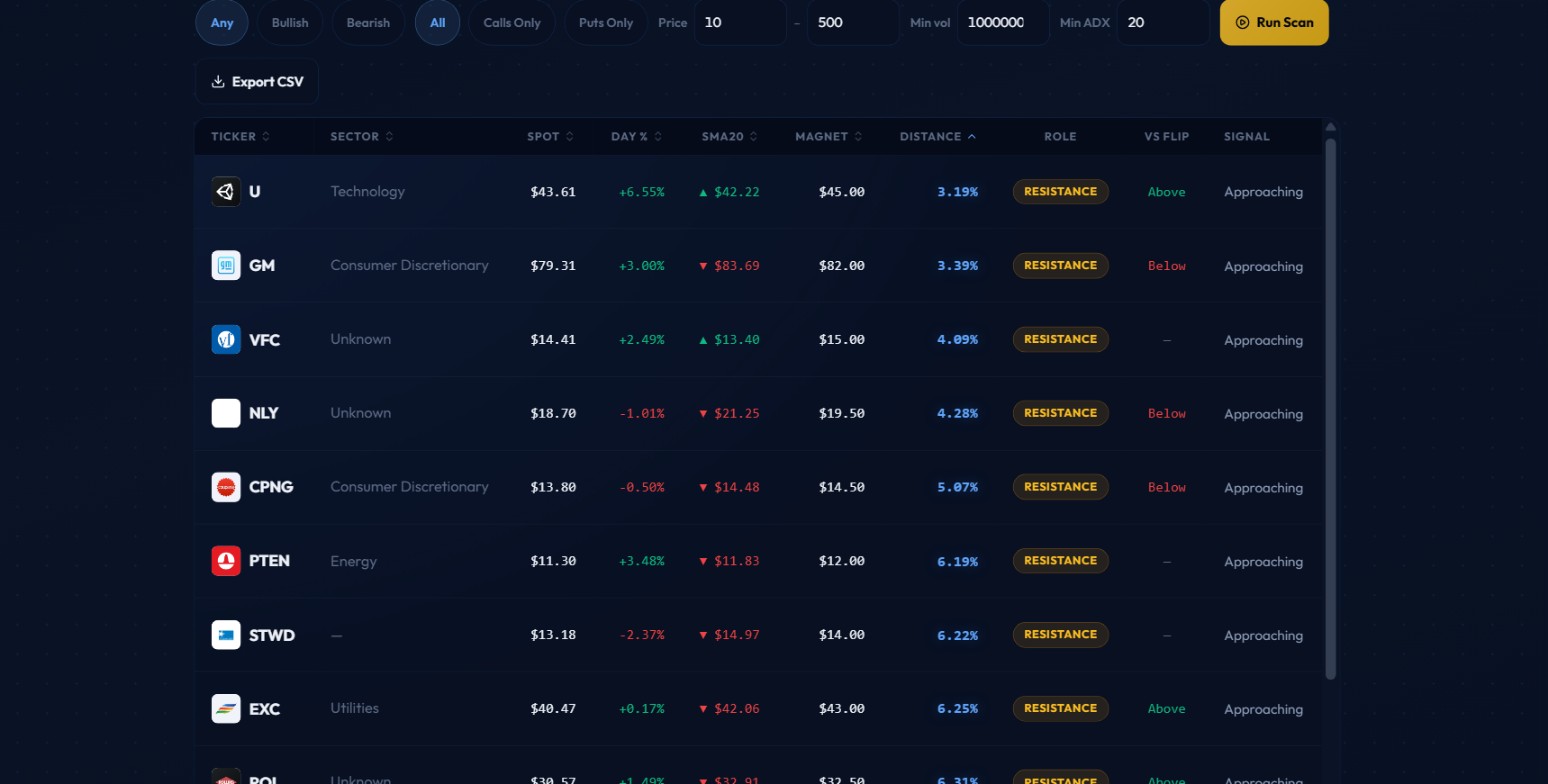 Results from October 1, 2026. All twelve tickers show Resistance and Approaching, consistent with a post-close scan on an up day. The final three rows scroll below the visible area.
All twelve tickers show Resistance and Approaching. That's consistent with a post-close scan: the session ended, no more intraday testing was happening, and the market had generally been up on the day.
The rows are sorted by distance ascending:
U (Unity Software, Technology): Spot $43.61, up 6.55% on the day. SMA20 $42.22 with the stock above it. Dominant magnet $45.00, 3.19% away. Vs Flip: Above (positive gamma). U was the closest to its magnet and in the better gamma environment for a potential pin. A 6.5% up day approaching a round-number resistance, above the 20-day, with positive gamma at the name. That's the row I'd have circled going into the next session.
Key point: U had direction (6.5% up day), SMA position (above the 20-day), and Vs Flip (positive gamma) all pointing the same way. When those three converge on the same row, that's what a clean magnet setup looks like.
GM (General Motors, Consumer Discretionary): Spot $79.31, up 3.00% on the day. SMA20 $83.69 with the stock below it. Dominant magnet $82.00, 3.39% away. Vs Flip: Below (negative gamma). GM was nearly as close to its magnet as U, but the setup reads differently: below the 20-day and in negative gamma, approaching resistance on a modest up day with no SMA tailwind.
VFC (VF Corporation): Spot $14.41, up 2.49%. Above the 20-day at $13.40. Magnet $15.00, 4.09%. No gamma flip data. $15 is a round-number magnet on a recovering name, with the SMA20 below spot.
NLY (Annaly Capital Management): Spot $18.70, down 1.01%. SMA20 is $21.25 and the stock is well below it. Magnet $19.50, 4.28%. Vs Flip: Below (negative gamma). NLY is a different situation from U: downtrend by the 20-day measure, negative gamma, approaching resistance overhead while down on the day. The Vs Flip column is doing work in that row.
CPNG (Coupang, Consumer Discretionary): Spot $13.80, down 0.50%. Below the 20-day ($14.48). Magnet $14.50, 5.07%. Below flip.
PTEN (Patterson-UTI Energy, Energy): Spot $11.30, up 3.48%. Below the 20-day ($11.83). Magnet $12.00, 6.19%. No flip. Up on the day but still under the 20-day.
STWD (Starwood Property Trust): Spot $13.18, down 2.37%. Below the 20-day ($14.97). Magnet $14.00, 6.22%. No flip. Well below its 20-day approaching resistance. This one has real distance to cover before the magnet matters.
EXC (Exelon, Utilities): Spot $40.47, up 0.17%. Below the 20-day ($42.06). Magnet $43.00, 6.25%. Above flip. Roughly flat on the day, below the 20-day, but in positive gamma at 6.25% away.
ROL (Rollins): Spot $30.57, up 1.49%. Below the 20-day ($32.91). Magnet $32.50, 6.31%. Above flip.
The three remaining tickers in the scan appear below the visible area of the screenshot. They sit at distances above 7%, in a mix of gamma regimes. At that distance you are cataloging a potential future setup, not acting on a same-session magnet play.
Watch out: NLY and CPNG were approaching Resistance from below after down days, already below their 20-day averages, and in negative gamma. STWD shared the down-day and below-20-day profile but had no gamma flip data. The same Distance percentage carries a different risk profile depending on Vs Flip and SMA position. Don't read the Distance column in isolation.
Looking across the nine visible rows: U and VFC were above their 20-day averages and trending toward their magnets on positive sessions. NLY, CPNG, and STWD were approaching resistance from below after down days, while already trading below their 20-day averages. EXC and ROL sit at similar distances in positive-gamma territory, which puts them in a materially different setup class from NLY and CPNG despite the similar percentage gaps.
My Levels: what it does when you have a watchlist
My Levels wasn't loading during the capture session that produced the screenshots, so I'm working from the code here. It uses the same table, same columns, same filters, but reads stored snapshots for your tracked tickers instead of running a live market scan.
The main control is the radius dropdown: 0.5%, 1%, 2%, or 5%. At 2%, a typical morning returns five to fifteen names. At 0.5%, you're looking at names sitting essentially on top of a magnet. At 5%, you're getting a wider morning inventory for names that will encounter their magnet sometime in the upcoming session.
Try this: Start My Levels at 2% radius. With 15-30 tickers tracked, you'll typically see two to five names any given morning. That's a manageable prep list. Expand to 5% on days when you want a wider view of which names might encounter their magnet later in the session.
If you're using My Levels for the first time, starting at 2% is reasonable. Most people have 15 to 30 tickers tracked; at 2% you'll typically see two to five names any given morning, which is a manageable prep list. Expanding to 5% gives you more coverage but also more names that are far enough away that they won't reach the magnet until late in the session, if at all.
Building a routine
Before the open, run a Scan the Market sweep with default filters. The results give you a morning list of names within 3-8% of a dominant magnet that pass the volume and ADX gates. Write down the ones with Above flip and Distance under 5%. Then for each interesting name, check Ticker Lab to understand the full levels structure and Unusual Activity to see if there's directional flow supporting a thesis.
During the session, switch to My Levels. Watch for Signal changes. An Approaching row turning into Tested 1x, holding is the first confirmation the level is real.
After the close, Scan the Market is a planning tool for the next session. The October 1 screenshots are exactly this: a post-close inventory of names entering the next day near their magnets.
One practical adjustment: the ADX filter defaults to 20. Raising it to 25 or 30 narrows results to names with stronger momentum, which tends to produce fewer but cleaner rows. Lowering it toward 10 opens up more names but pulls in a lot of sideways movers where magnet mechanics don't translate cleanly.
There's a question I don't have a clean answer to yet: how much does the score of the dominant strike matter relative to the second-ranked level? The scanner surfaces the top strike per name, but the backend keeps the top 8. A name where the top level scores 100 and the second scores 30 is probably pinning harder than one where the top two are both at 90. That information isn't currently surfaced on the page, but it's something I'd want to know before sizing heavily into any individual magnet play.
The ADX filter also plays an underappreciated role in result quality. On a low-volatility day when the broad market is barely moving, a lot of names will have ADX readings under 20. Raising the ADX minimum on those days pulls the list toward names with idiosyncratic momentum rather than just market drift, which tends to produce more usable setups. On high-volatility days where everything is moving, the default 20 does more work and you can leave it there.
What to watch for (and what to avoid)
Signals that strengthen the setup:
- Signal shows TESTED Nx HOLDING: the level absorbed real pressure and held. This is confirmed evidence, not a hypothesis.
- Vs Flip shows Above: positive gamma means dealer hedging dampens moves and works in favor of pin-based setups.
- The name is trending toward the level and above its 20-day SMA. A stock in a healthy uptrend approaching resistance is positioned differently from one already below its average.
- Unusual Activity confirms direction. Flow into a name approaching Resistance, where someone paid real premium on calls, is the cleanest convergence this scanner produces.
Signals that weaken the setup:
- Signal shows BROKE THROUGH: the role flipped this session. Wait for a re-test from the new side.
- Vs Flip shows Below: negative gamma amplifies moves. Credit structures at magnets are significantly riskier here.
- Earnings inside the hold period: a surprise print overrides dealer hedging completely.
- Distance over 7% with default scan filters: at that range you're monitoring for a future setup, not trading one.
Three mistakes that cost money
Treating Approaching and Tested holding as the same setup. Approaching is a hypothesis. Tested holding is evidence. One means you're planning around a level; the other means the level already absorbed real pressure and held. Position sizing should reflect that difference.
Running a credit structure at a magnet when Vs Flip says Below. Sell a call spread at resistance, the name is in negative gamma, and a shove sends it through. Dealer hedging amplifies the break. The spread goes to max loss fast. Check the flip column before sizing into any defined-risk trade.
Treating Scan the Market as a monitor. Editing a filter and waiting doesn't produce new results; run the scan again when you want a fresh look. For watching names you already follow, My Levels is the better mode.
How it pairs with the other tools
GEX shows the index-level dealer position. Even a well-positioned single-name magnet works differently when the whole market is in negative gamma versus a quiet pinning regime. Check the GEX page for macro context before any magnet-based trade.
Ticker Lab lets you model the options structure for a specific name. Once the scanner finds a candidate, Ticker Lab shows the full levels picture, lets you pick an expiration, and shows what a spread positioned at the magnet looks like at expiry.
Unusual Activity is the scored feed of $20k-plus options prints. A name near a Resistance magnet with repeat call sweeps is two independent inputs pointing the same direction.
Dark Pool covers off-exchange block prints. A name approaching Support on the magnet scanner, with accumulation lean in the dark pool, is getting the same signal from two entirely different markets.
Breaking Out identifies breakout setup candidates. When a name appears there and has a dominant magnet resistance just above the breakout point, the scanner tells you where dealer supply will concentrate if the breakout attempt runs.
What the page is not
The scanner finds proximity and classifies today's price behavior at each level. It doesn't know whether any particular level holds. It doesn't account for earnings, macro events, or anything outside the options chain structure.
The October 1 results showed all Approaching, all Resistance, because the session was over and the market had been up. On a different session, you'd see more variety: some Tested and holding from names that tested intraday, some Broke through from levels that failed, and a mix of Support and Resistance depending on market direction. The uniform-looking snapshot from that day is a function of the timing, not the tool.
One thing I'd add about the results more broadly: the Distance column alone doesn't tell you how fast a name is moving toward its magnet. U at 3.19% away after a 6.5% up day is in a different posture than EXC at 6.25% away after a 0.17% session. A name closing hard into a level is more likely to test it early in the next session than one that drifted sideways nearby. The Day % column and SMA20 together give you a sense of that momentum; neither shows up in the Distance sort, so scan the whole row, not just the top of the list.
The Vs Flip column is also doing more work than it might look like. A 4% distance with Vs Flip Below is a meaningfully different trade than the same distance with Vs Flip Above. Negative gamma environments have a higher base rate of levels failing because dealers are amplifying moves rather than dampening them. I don't treat the two as equivalent setups.
Options trading involves substantial risk. Nothing here is investment advice or a recommendation to buy or sell any security.