
Options Screeners deep dive · 19 min read
How to Use the Accumulation Watch Screener
A deep walk through TraderMatrix's two-signal screener: what option-volume trend and institutional buying data actually measure, how each of the 8 parameters controls the bar, and why an empty result is often the most honest thing the page can tell you.
Open the tool →Hey guys, Art from TraderMatrix here. The screenshots you'll see in this article were taken on October 1, 2026, after the close. The screener returned zero results that session, both at its defaults and with four filters loosened nearly to their floors. I'm starting there because that empty state is genuinely the best teaching example I could have captured, and it tells you more about how this screener works than a session with 15 results would.
Let me explain what Accumulation Watch is trying to do before we walk the page.
The short version:
- Both legs must fire simultaneously: multi-week option-volume acceleration AND an active institutional ETF-buying streak. Neither alone qualifies a name.
- An empty result is honest market information, not a platform failure. When the overlap isn't present anywhere in the universe, the scan says so plainly.
- Eight parameters control the bar. The defaults are intentionally modest because the two-signal requirement is already a high filter.
- Check the chart and earnings calendar on every result. The screener measures positioning but cannot tell you why funds are buying.
- Vol Growth multiple and Inst. Streak days are the two numbers to compare when ranking results.
What accumulation actually means
When a fund wants to build a meaningful position in a stock, they don't send one order. A $50 million buy in a stock that does $30 million in daily volume would move the price against them before the order was half filled. So they work in smaller pieces, over days and sometimes weeks, through instruments that don't immediately move the underlying. Options are one route. ETF rebalancing is another. The position builds gradually, the stock sits in a range nobody is paying attention to, and by the time the broader market notices the move, the accumulation is over.
This is the pattern Accumulation Watch is designed to catch: names where that quiet building process is still happening. Not the breakout. Not the headlines. The period before that, when the signal is still visible if you know where to look.
There's a specific version of this that options flow tools already catch: single unusual prints. A sweep in calls that clears $1 million in premium with volume at 10x normal gets flagged by the Unusual Activity feed at /unusual-activity. That's a one-print signal. Useful, but it could be a directional bet, a hedge, an income play, or noise. You can't tell from a single event.
The Accumulation Watch screener is asking a different question. Not "did something unusual happen today?" but "has option activity been accelerating on this name for the past several weeks, and is institutional ETF buying confirming the same thesis at the same time?" That's a more patient, multi-week signal and it requires both legs simultaneously.
Why two independent signals are required
The option-volume trend leg measures whether the rolling 5-day average of total option contracts on a ticker is at least 1.5 times the 10-day baseline that came before it. If it is, and if the most recent data is within 7 calendar days, the options desk has been getting progressively louder on this name for going on three weeks. One session spike doesn't qualify. The trend has to be sustained.
The institutional buying leg checks ETF fund data. It asks: is a BUYING stance the most recent institutional snapshot for this ticker, and has that streak been active for at least 3 consecutive days or across at least 2 distinct funds? This comes from a completely separate data source. ETF fund managers are not talking to options desks. When both sources point to the same ticker at the same time, the overlap is meaningful.
Neither leg alone qualifies a name. That's the core design decision. A ticker with strong option-volume acceleration and no institutional confirmation gets filtered out. So does a ticker where ETF funds are buying but option activity is flat. You need both signals simultaneously.
The reason for the two-signal requirement isn't to make the bar harder to clear. It's to make the bar mean something specific. A single source can be noise, a hedge, a mechanical rebalance. Two independent sources pointing the same direction at the same time is a harder thing to dismiss.
Key point: Two completely separate data feeds pointing to the same ticker at the same time is genuinely hard to dismiss. A single source can be noise, a hedge, or a mechanical rebalance.
The page at first open
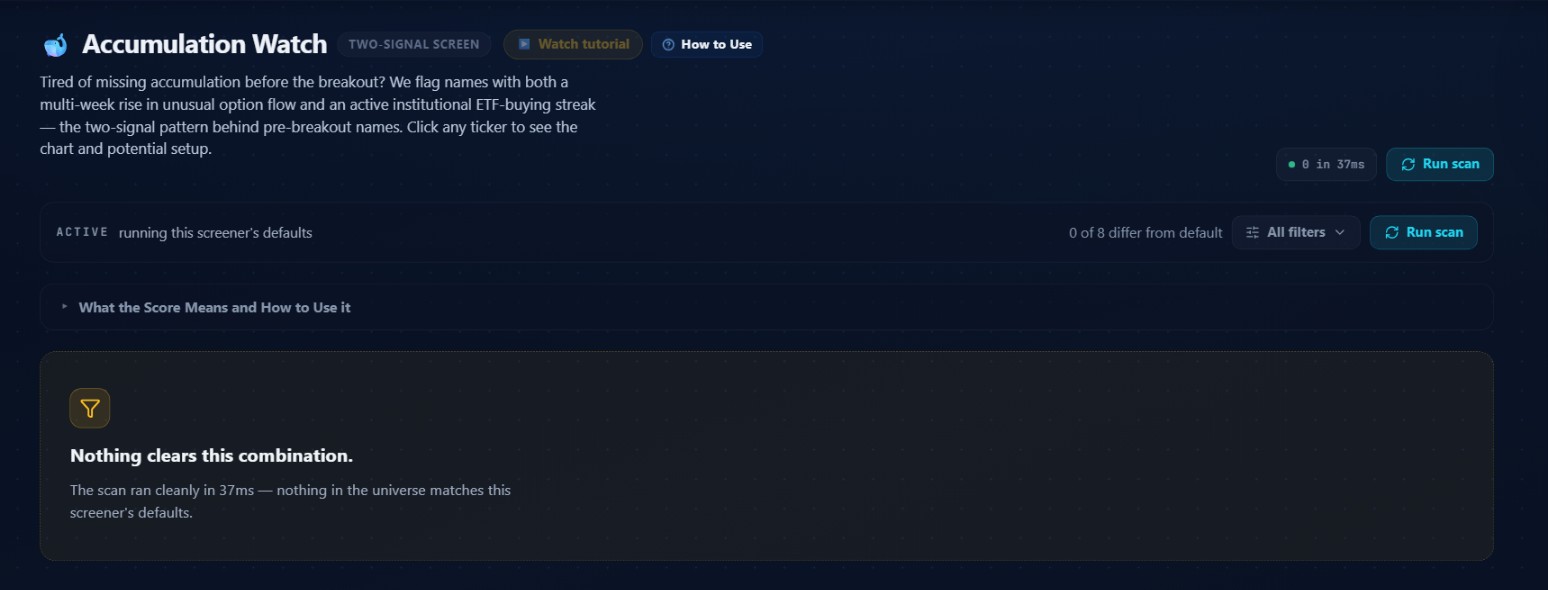 October 1, 2026, after the close. Default settings. The scan ran cleanly and returned nothing. The filter bar shows 0 of 8 parameters differ from default.
The page opens with the header "Accumulation Watch" and a "TWO-SIGNAL SCREEN" tag right next to it. Two buttons sit next to the tag: "Watch tutorial" and "How to Use." Below the title, the description reads: "Tired of missing accumulation before the breakout? We flag names with both a multi-week rise in unusual option flow and an active institutional ETF-buying streak, the two-signal pattern behind pre-breakout names. Click any ticker to see the chart and potential setup."
The filter status bar shows "ACTIVE running this screener's defaults" on the left and "0 of 8 differ from default" on the right, with an "All filters" control and a "Run scan" button. The "0 of 8" count tells you exactly how many of the 8 parameters have been changed from their factory values.
Below the filter bar is a collapsible "What the Score Means and How to Use it" section. Worth opening the first few times you use the page.
Then the empty state. A filter icon, bold text reading "Nothing clears this combination," and a subtitle: "The scan ran cleanly, nothing in the universe matches this screener's defaults."
What an empty scan is actually saying
Most users see zero results and assume something is wrong. The tool broke. The market is dead.
An empty result from Accumulation Watch means exactly one thing: right now, no ticker in the universe satisfies both legs simultaneously. Not one ticker has its option-volume trend and its institutional buying streak active at the same time at these parameter settings.
That's a high bar. In certain market regimes, it's a bar that genuinely doesn't get cleared. Post-earnings uncertainty, risk-off sessions where funds are pulling back across the board, periods of broad sideways chop where nothing is accelerating in any sustained direction. The screener is reflecting real conditions, not failing to find them.
The wording tells you the scan ran clean. It checked everything it tracks, found no overlap, and reported that plainly.
There's also a structural reason for thin results that's worth knowing upfront. The option-volume trend calculation needs at least 15 trading days of history per ticker to compute: 5 for the recent window plus 10 for the baseline window. Tickers that haven't accumulated that history in the platform's rollup table simply won't appear yet, regardless of how active their options are. The code for this screener explicitly labels thin early results as expected behavior, not a bug. If you're seeing zero results in the first few weeks of using the platform, part of the reason is history still building up.
What you do with an empty result: check back the next session. The two-signal overlap isn't always present. When it appears, it's meaningful partly because it isn't always there.
Watch out: Fresh accounts may see zero results for the first few weeks while the rollup table builds 15 trading days of history per ticker. That is expected behavior in the code, not a bug.
The filters panel: all 8 parameters
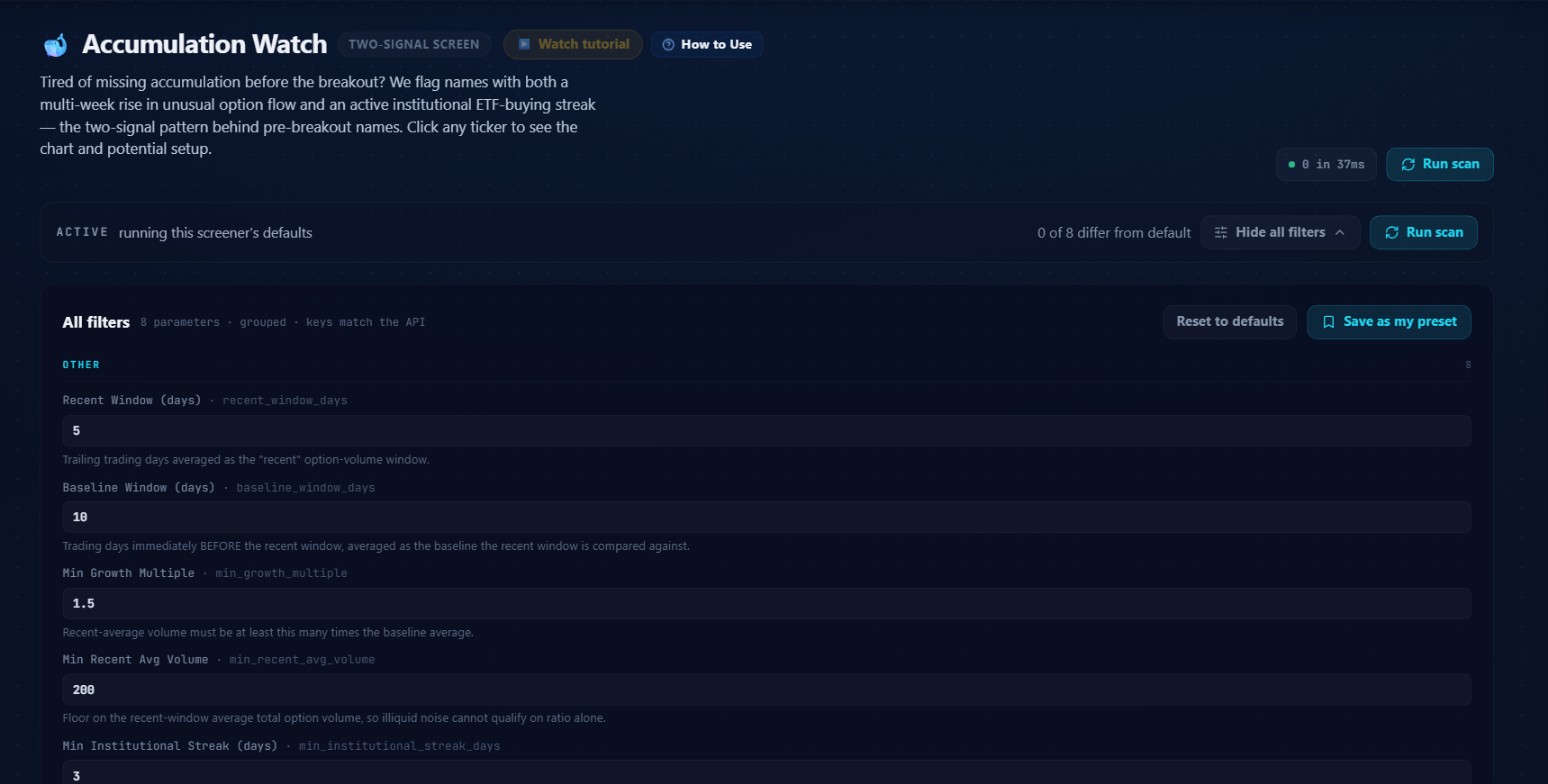 The upper portion of the parameter panel at factory defaults. The key field below each label shows the API name. Save as my preset persists your configuration for future sessions.
 Min Fund Count, Weeklies-Added Lookback, and Results Count from the same panel. These three cover the institutional leg gate, the weeklies informational lookback, and the output limit.
Clicking "All filters" opens the parameter panel. There are 8 controls total, a "Reset to defaults" button, and a "Save as my preset" option to store your configuration. Here's what each one does.
| Parameter | Default | Range | Controls |
|---|---|---|---|
| Recent Window (days) | 5 | 3-20 | Trailing trading days averaged as the recent option-volume window |
| Baseline Window (days) | 10 | 5-40 | The reference window immediately before the recent window |
| Min Growth Multiple | 1.5 | 1.1-5.0 | How many times larger the recent average must be vs the baseline |
| Min Recent Avg Volume | 200 | 0-100k | Absolute floor on recent average in contracts per day |
| Min Institutional Streak (days) | 3 | 1-30 | Minimum consecutive days of active ETF BUYING |
| Min Fund Count | 2 | 1-20 | Minimum distinct funds in the active buying streak |
| Weeklies-Added Lookback (days) | 90 | 7-365 | How far back to check for new CBOE weekly listings (informational only) |
| Results Count | 25 | 5-100 | How many results to return, sorted by Vol Growth descending |
Recent Window and Baseline Window
These two parameters define the comparison. At defaults, the screener averages the trailing 5 trading days of option volume and compares that against the 10 trading days before that. Together they span roughly three trading weeks of history per ticker.
Lowering the recent window to 3 days makes the screener more sensitive, catching acceleration earlier. But 3-day averages are also noisier. A Thursday-Friday options surge that doesn't continue into the next week would qualify briefly and then fall off. Raising it to 10 or 15 days means you want to see elevated activity over two or three weeks, which produces fewer results but further into a sustained trend.
The baseline window is the reference point. Making it longer (say, 20 or 30 days) means the denominator covers more history, which makes it harder for a name to clear the growth multiple. A ticker whose options were already somewhat active several weeks ago will show a smaller multiple when compared against a longer baseline.
API names: recent_window_days and baseline_window_days.
Min Growth Multiple
At 1.5, the recent average needs to be 50% higher than the baseline. At 2.0, it needs to have doubled. At 1.1, almost any uptick qualifies.
The 1.5 default is intentionally modest because the institutional buying leg is doing a lot of filtering work. Raising this to 2.5 or higher narrows to names with more dramatic option-volume acceleration. The names that clear a higher multiple tend to be further along in the buildup than names barely clearing 1.5.
API name: min_growth_multiple.
Min Recent Avg Volume
This floor exists because ratio math alone would let illiquid names through. A ticker that normally does 5 contracts a day and recently did 10 is a 2x multiple. It's also meaningless. Nobody is positioning 10 contracts a day. The 200 contracts per day floor prevents names with no meaningful options market from qualifying on ratio alone.
Raising this to 500 or 1,000 narrows to names with more liquid options, which matters if you want to trade options on any names you find here rather than the underlying stock.
API name: min_recent_avg_volume.
Min Institutional Streak and Min Fund Count
These two parameters control the institutional leg, and they work as OR conditions rather than AND. A ticker qualifies the institutional leg if its streak is at least 3 days OR its fund count is at least 2. Either one is enough.
This design means two different patterns of institutional conviction both qualify. One fund buying the same name for 7 consecutive days passes because streak >= 3. Two funds buying the same name for 2 days each passes because fund_count >= 2. Both patterns suggest genuine positioning, just with different structures behind them.
Raising Min Institutional Streak to 5 or 7 days narrows to only the most sustained buying programs. Raising Min Fund Count to 3 or 4 narrows to names with broader institutional support. Either change will reduce the result count, but the names that do qualify will have more weight behind the institutional leg.
Try this: Run the screener at defaults, then raise Min Institutional Streak to 5 days. Names that survive the tighter bar have the most durable buying streaks in the universe that session.
API names: min_institutional_streak_days and min_fund_count.
Weeklies-Added Lookback
This parameter is different from all the others: it's informational only. Changing it never changes what qualifies. It only controls how far back the screener looks when deciding whether to put "Yes" or "No" in the Weeklies Added column of each result row.
What that column shows is whether CBOE has recently listed weekly options on a given ticker. New weekly option listings often accompany rising interest in a name. When a ticker that's already showing two-signal confirmation also just had weeklies added, it can suggest that demand for options on this name has expanded to where the exchange responded. But it's a background detail, not a signal. It doesn't affect what qualifies or how results are ranked.
API name: weeklies_lookback_days.
Results Count
The screener returns results sorted by Vol Growth multiple descending. At 25, you get the top 25 qualifying names. Raising to 50 or 100 is useful in active periods, but when both signals are required simultaneously, the list tends to stay short even at higher limits.
API name: top_results.
What happens when you loosen the filters
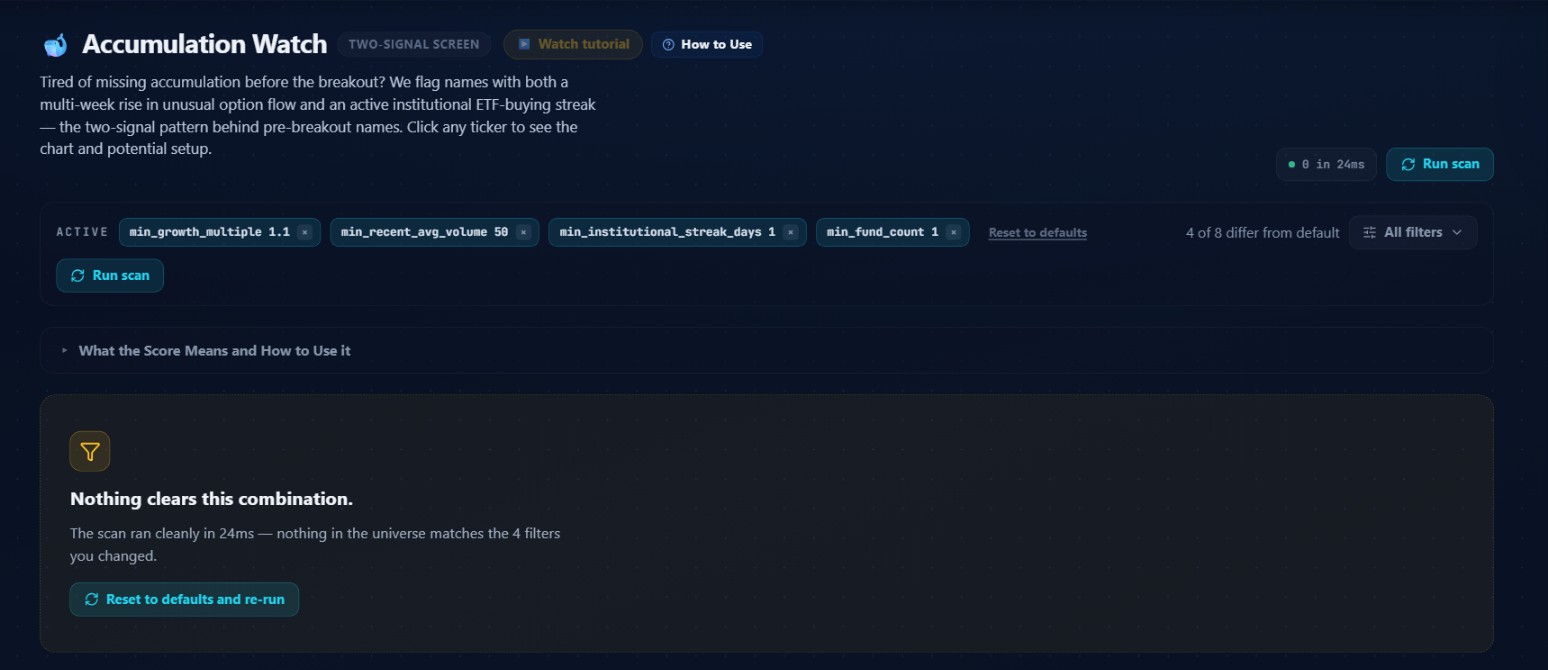 Four parameters pulled near their minimum values on October 1, 2026. Filter chips along the status bar show each active change. Still nothing cleared.
Screenshot 3 shows what happened when I reduced four parameters to near their minimum values: Min Growth Multiple to 1.1, Min Recent Avg Volume to 50, Min Institutional Streak to 1, and Min Fund Count to 1. The filter chips appear in the status bar, each showing the active change with an X to remove it. The counter reads "4 of 8 differ from default."
Result: still empty. "The scan ran cleanly, nothing in the universe matches the 4 filters you changed."
At a growth multiple of 1.1 and a fund count of 1, the screener should be fairly easy to pass most sessions. The fact that it wasn't reflects real October 1 market conditions. The two-signal overlap wasn't present anywhere in the universe, even with generous parameters. That's market information, not a platform limitation.
The empty state shows a "Reset to defaults and re-run" button. One click restores everything if you want to go back to the standard read after experimenting.
What a result row contains
When the scan returns names, each row gives you:
- Ticker: clickable, opens the chart and setup view for that name.
- Price and the day's percentage change.
- Vol Growth: the growth multiple formatted as e.g. "2.40x." Recent-window average divided by baseline average. The table defaults to sorting by this column, highest multiple first.
- Recent Avg Vol: the recent-window daily average in contracts. The absolute number, not the ratio. This is what the Min Recent Avg Volume floor is applied against.
- Baseline Avg Vol: the baseline-window daily average, shown alongside the recent average so you can see the raw volume level behind the ratio. A name going from 500 to 1,200 contracts per day (2.40x) looks different from one going from 5,000 to 12,000 (also 2.40x) when you're thinking about liquidity and position sizing.
- Inst. Streak (d): how many consecutive days the institutional buying streak has been running, shown as "5d" or "8d."
- Inst. Funds: how many distinct ETF funds are part of the active buying streak. More funds means the institutional conviction is spread across multiple independent buyers.
- Weeklies Added: "Yes" or "No." Whether CBOE listed weekly options on this name within the lookback window.
How the institutional signal actually works
The logic here is more careful than it first appears, and the detail matters.
The screener queries the institutional ETF snapshot data and finds each candidate ticker's single most recent snapshot within the last 10 calendar days. That "most recent" framing is critical. The system doesn't look for whether a BUYING record exists somewhere in the last 10 days. It finds the ticker's latest stance, the most current snapshot, and then checks whether that stance is currently BUYING.
Here's why that distinction matters. A ticker could have a BUYING record from 4 days ago and a newer SELLING record from 2 days ago. A query that just searched for "any BUYING record in the last 10 days" would flag that ticker. This screener won't. It finds the latest row by date, and if that row says SELLING, the ticker doesn't qualify, regardless of what an older BUYING record showed.
The 10-day max age means that if no institutional snapshot exists within the last 10 calendar days, the ticker is treated as having no current institutional stance at all. Historical buying from three weeks ago doesn't count.
Combined with the 7-day recency check on the option-volume side (the most recent rollup row must be within 7 calendar days of today), both legs of the two-signal requirement are time-bounded. You're always reading active, current positioning, not historical data that happened to clear the bar once and has been stale since.
Key point: The screener finds the ticker's most recent institutional snapshot, not just any BUYING record in the window. A BUYING stance from four days ago doesn't qualify if a newer SELLING record came in since. Recency is everything on the institutional leg.
The 7-day limit on the options side comes from how the rollup table works. The screener ranks each ticker's rows by date and takes the most recent batch. But the table only gets a row on days a ticker had unusual-flagged option flow. A ticker with a volume burst from three weeks ago and silence since could fill its entire "recent" window with stale rows and still show a high growth multiple. The 7-day bound prevents that: if the most recent row is older than 7 calendar days, the ticker doesn't qualify as having a current trend. This is a fixed constraint, not a user-configurable parameter.
Building a daily routine
The natural cadence for Accumulation Watch is once per session, usually in the morning before the open. These signals don't shift minute to minute. You're looking for names that have been building for a week or more, so a daily check is the right rhythm.
Open the page at default settings first and note the result count. If there are results, go through them one at a time and ask: how strong is the Vol Growth multiple? Is it 1.5x barely clearing the threshold, or 2.5x with clear acceleration? How long has the institutional streak been running and how many funds are in it? A streak of 7 days with 4 funds carries more weight than 3 days with 2 funds, even though both qualified.
Then open the chart for anything that looks compelling. This is not optional. The screener tells you about options positioning and institutional buying. It says nothing about the technical setup. A name can have excellent two-signal confirmation and a chart showing clear distribution. Or it can show a multi-week base building below resistance, with declining daily volume while options positioning grows. The second setup is what this screener was built to surface, but it can't tell the difference for you.
Try this: After pulling up a chart from here, search the same name in Unusual Activity. Option-volume trend growth on this screener plus high-scored call sweeps there is two independent options reads pointing the same direction.
After the chart, cross-reference with Unusual Activity. If the screener shows option-volume trend growth on a name and Unusual Activity shows high-scored call sweeps in the same recent window, you have the trend data and individual print data both confirming from the options side, plus the institutional buying from a separate source. That's a stronger combined read.
For names that survive both checks, the Hedge Fund Tracker at /etf-tracker lets you go deeper on the institutional side. The screener tells you the trend is active and the buying is current. The tracker shows which specific ETFs hold the name and how their positions have shifted across recent periods. A name where multiple funds have been adding meaningfully over the last filing cycle is a more grounded thesis than one where the streak is 3 days old with 2 funds.
How this compares to the other options flow tools
Accumulation Watch lives in a different time horizon from every other tool in the Options Flow section.
| Tool | Time horizon | What it shows |
|---|---|---|
| Unusual Activity | Today's tape | Scored individual prints above $20k, one row per event |
| Live Flow | Today, per ticker | Total premium, trade count, bull/bear split, latest big print |
| Heat Map | Right now | Ticker tiles showing where flow concentrates, urgency board |
| Accumulation Watch | 15+ trading days | Multi-week option trend plus institutional buying streak |
That difference is exactly why pairing it with Breaking Out makes sense as a workflow. Accumulation Watch catches names in the buildup phase, while the chart is still compressed. Breaking Out catches the moment a setup completes technically and a name clears its base. If a name has been on Accumulation Watch for several sessions and then shows up on Breaking Out, the flow thesis has technical confirmation behind it.
Three mistakes worth naming
Acting on Vol Growth while the institutional columns are blank. The Inst. Streak and Inst. Funds columns require both signals to be present and confirmed. If you see a high Vol Growth multiple but blank institutional data in those columns, you're only reading half the screen. The screener requires both signals. Acting on one half defeats the whole design.
Skipping the chart. Options positioning and institutional buying tell you about the direction people are positioning. They don't tell you about the technical structure the position is building toward. A stock in a clear downtrend with rising options positioning could be a hedge, not a directional bet. Always open the chart.
Pre-earnings flow. Institutional flows in the weeks before earnings can be hedges on existing positions, not new directional bets. A fund manager sitting on a large long who wants binary protection could be doing exactly what the screener reads as a buying streak, without it being a new accumulation thesis at all. The screener doesn't distinguish. If a name from Accumulation Watch has earnings inside the next two weeks, treat the signal differently.
Watch out: Pre-earnings institutional flows can be hedges on existing long positions, not new accumulation. A fund protecting a large holding looks identical to a fund building a new position from the screener's data.
What this signal can and can't tell you
Options flow and institutional positioning data show what's happening, not why it's happening. The screener can confirm that option volume has been growing on a name for 15 trading days and that ETF funds have been buying it for at least 3 consecutive days or across 2 funds. It cannot tell you whether that reflects a directional bet on an expected catalyst, a portfolio hedge against an existing position, or a mechanical rebalancing that happened to land on this ticker.
Two of those three interpretations support the thesis the screener implies. One doesn't. There's no way to tell from the data alone which one you're looking at.
This is the honest limit of any tool that aggregates positioning data. The signal shows magnitude and direction. The interpretation of intent requires the additional context the screener can't provide: the chart, the earnings calendar, the news environment, your own judgment about whether the thesis makes sense given the sector and macro backdrop.
I use this screener as one filter in a multi-step process, not as a standalone entry trigger. As a filter, the two-signal requirement genuinely does narrow the universe to names where independent sources are pointing the same direction at the same time, and that's a useful starting point. Whether what you find becomes a trade depends on everything else you check after this.
Nothing in this article is investment advice. Trading involves real financial risk and you can lose money. Past screener outputs don't predict future results. Always check the chart, the earnings calendar, and your own risk rules before entering any position.